GoJS Samples
Our samples demonstrate several Diagram types and showcase specific features and layouts. You can use the HTML and JavaScript in these samples as the starting point for your application.
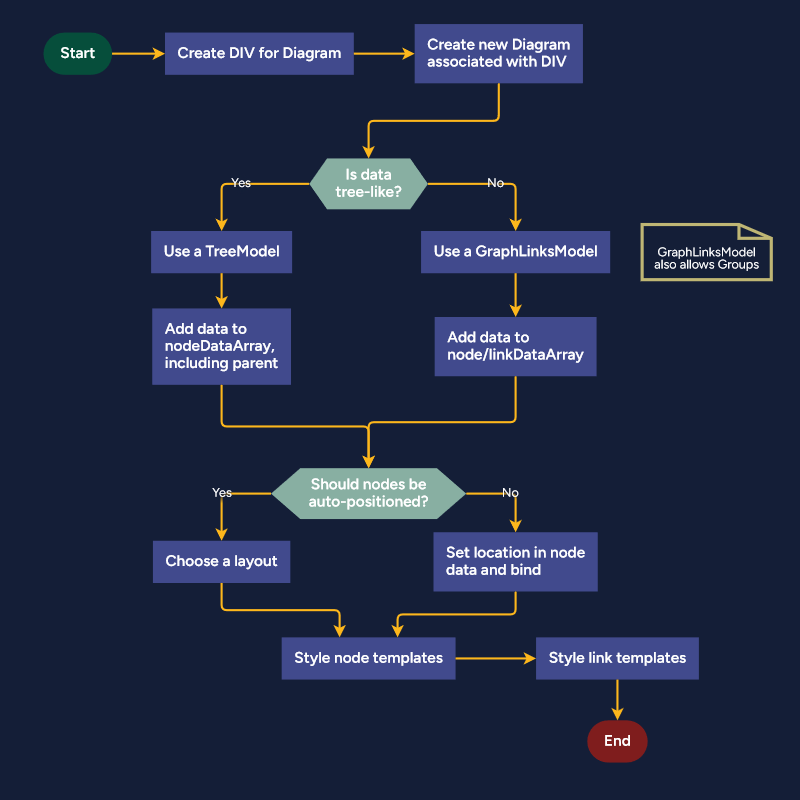
If you are done looking around and are ready to experiment with GoJS, read the getting started tutorial.
We are happy to help prospective customers make their proof-of-concept. If you need help getting started, contact us.
If you want to search the source code, you can download a copy of all samples via the npm command:
npm create gojs-kit@latest
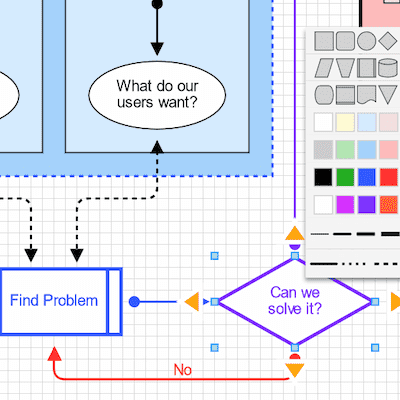
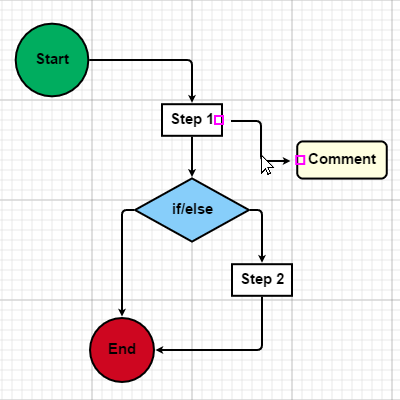
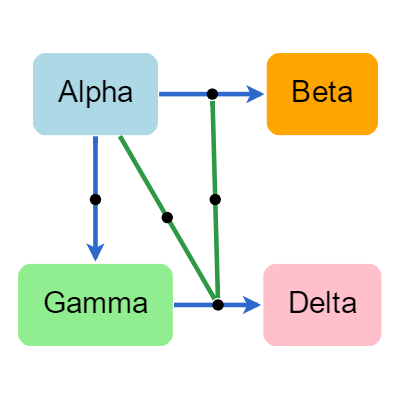
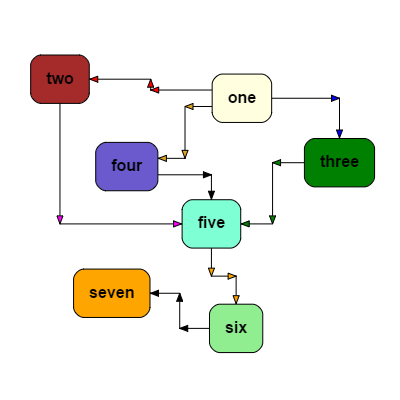
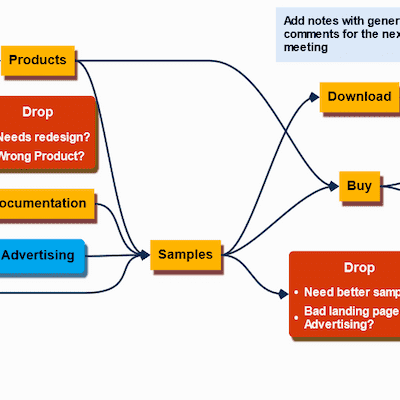
Interactive Flowchart
A flowchart and palette, showing different node templates and data bindings. Each node has only one port element. Links are orthogonal and automatically route to avoid nodes.
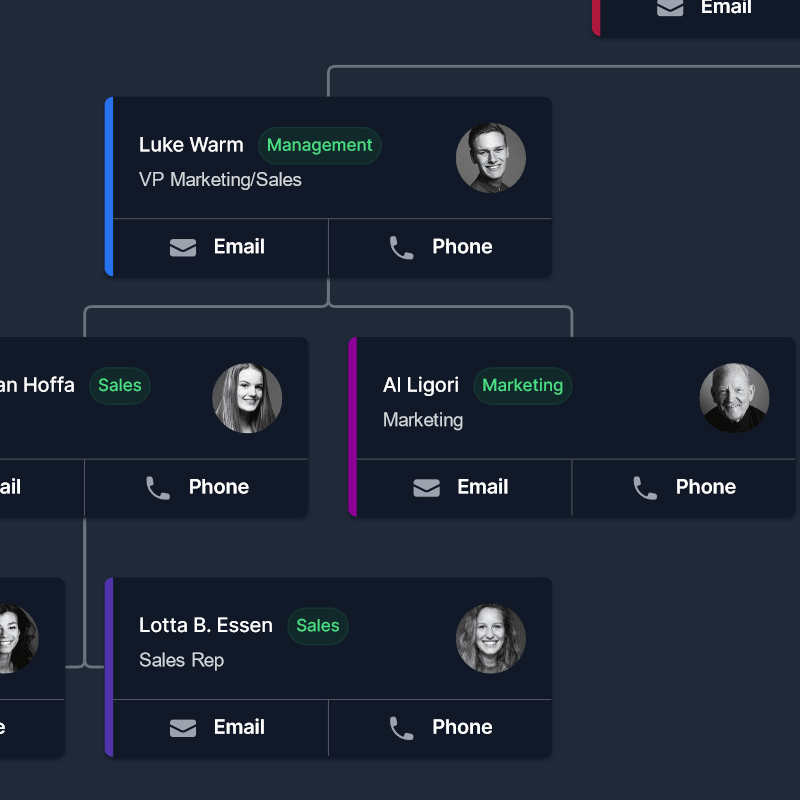
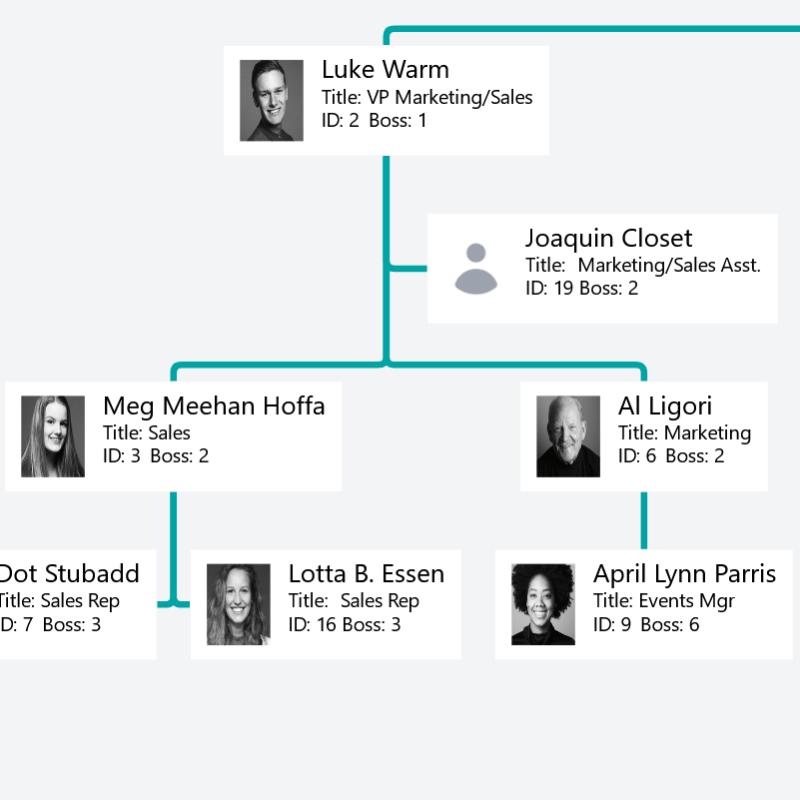
Organizational Chart Editor
An organizational chart that allows user editing and re-organizing of the hierarchy.
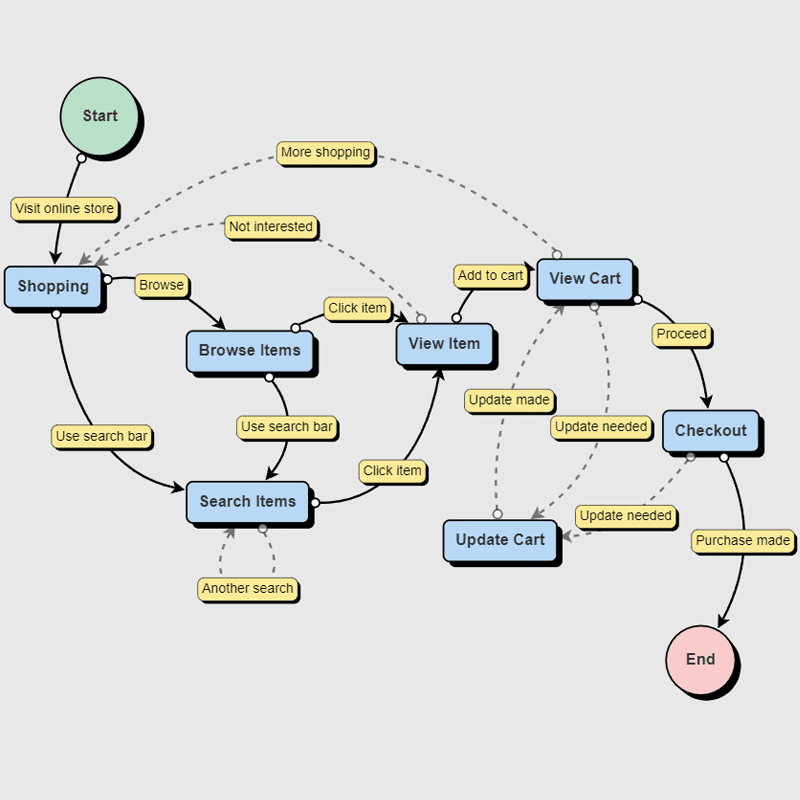
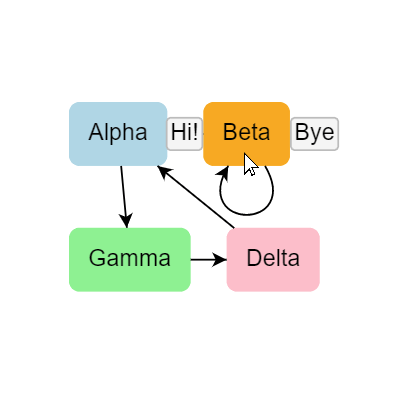
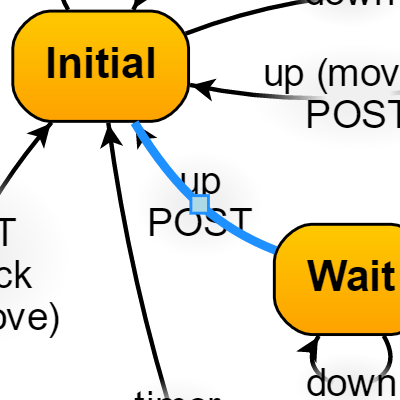
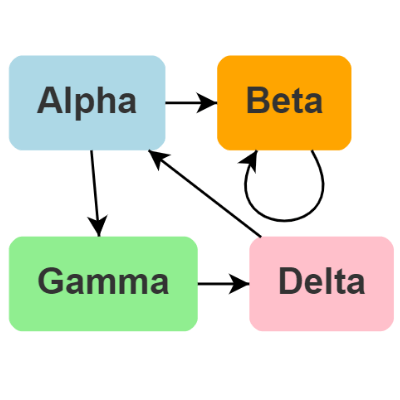
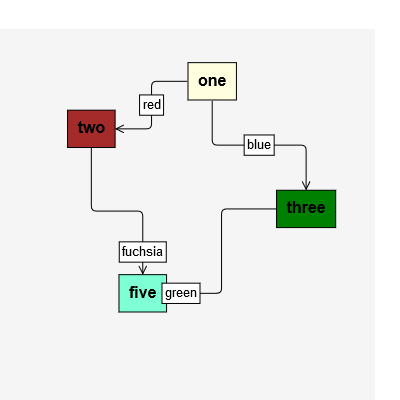
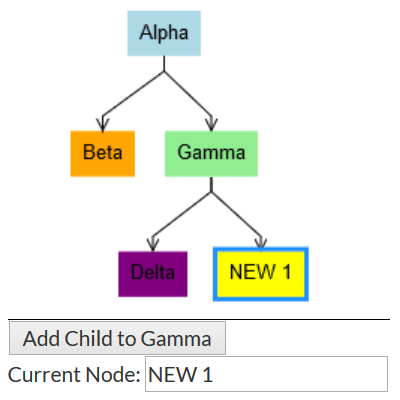
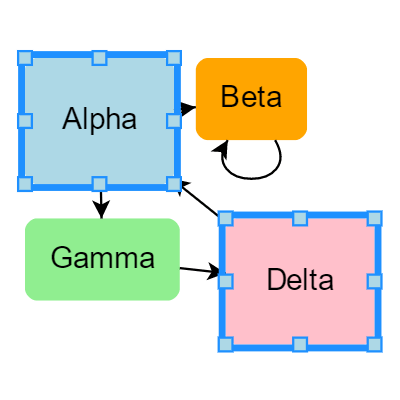
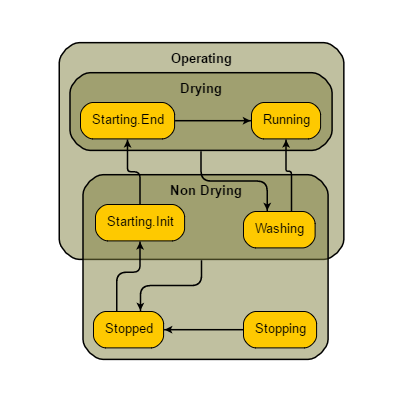
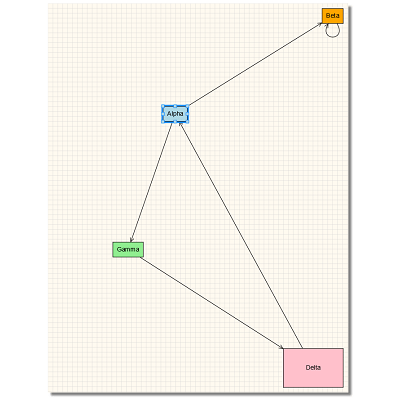
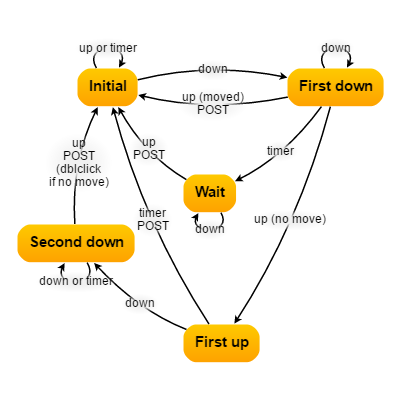
State Chart Editor
A state chart diagram that also shows dynamic creation of new nodes and links on a button press.
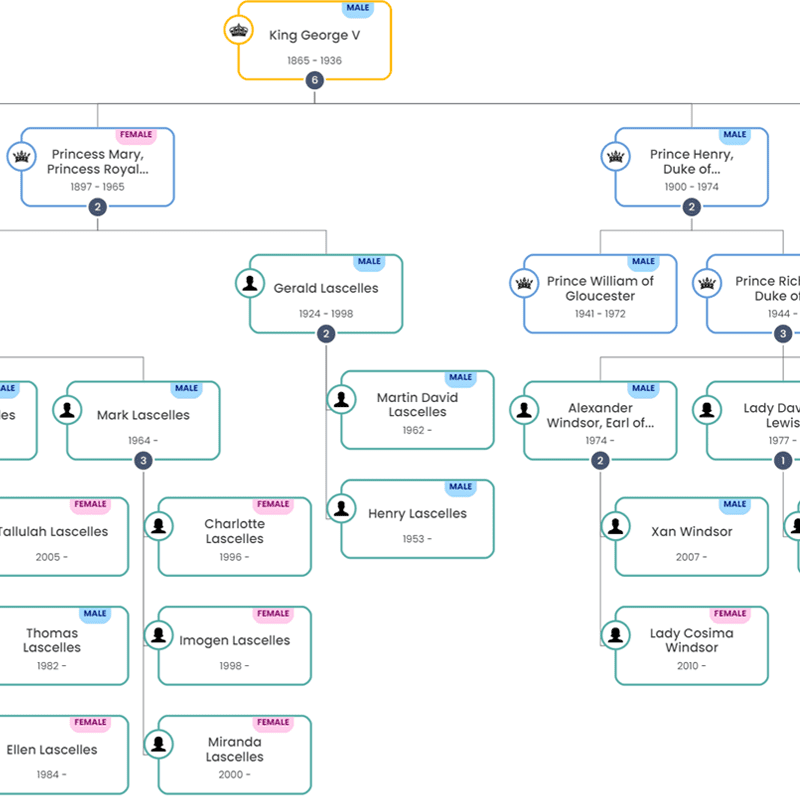
Family Tree
Shows a standard family tree.
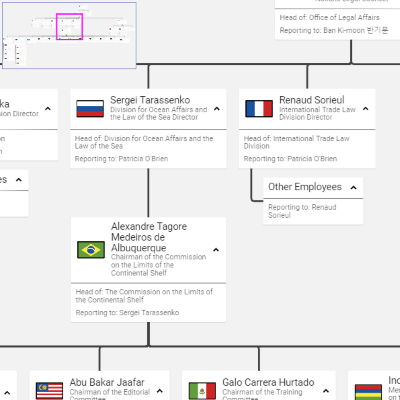
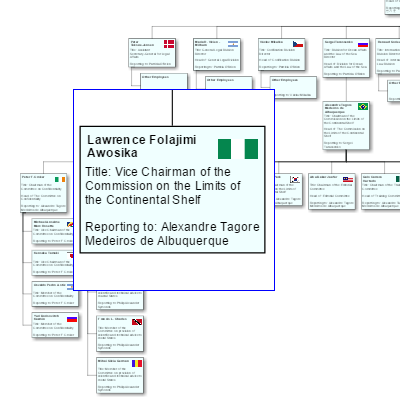
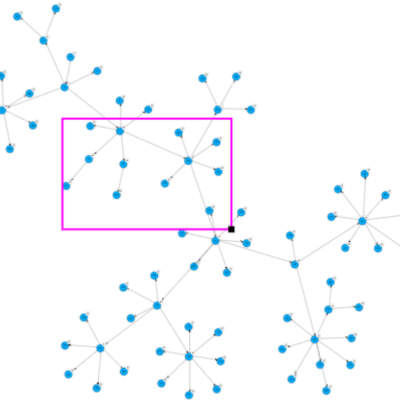
Org Chart with Overview
Shows an organizational chart, uses an in-laid Overview to aid the user in navigation, and allows the user to search by example.
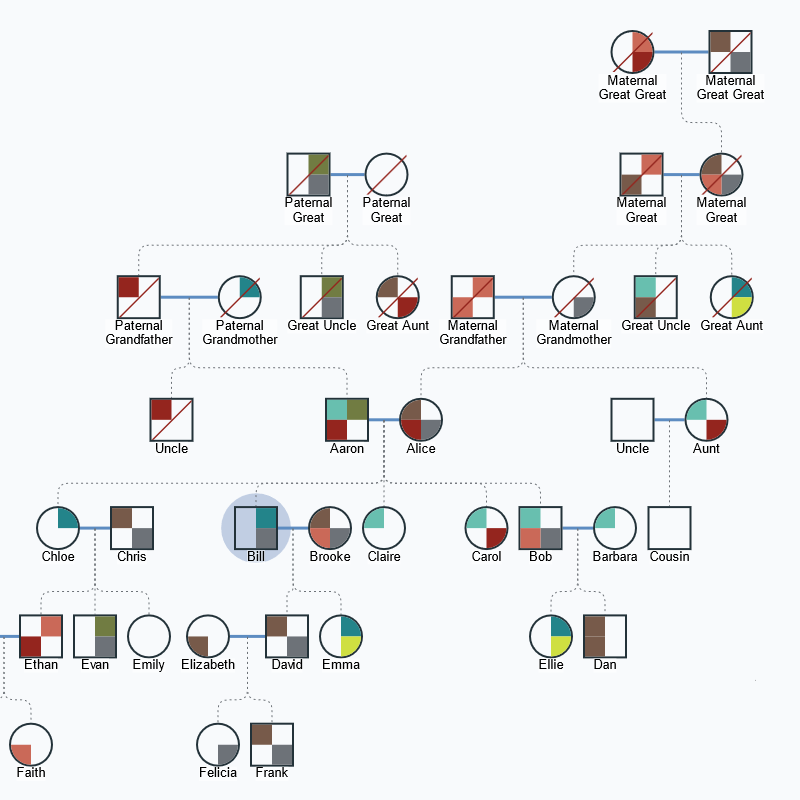
Genogram Family Tree
A genogram or pedigree chart is an extended family tree diagram that show information about each person or each relationship.
SCADA Industrial Monitor
Example of a SCADA industrial monitoring diagram with updating data.
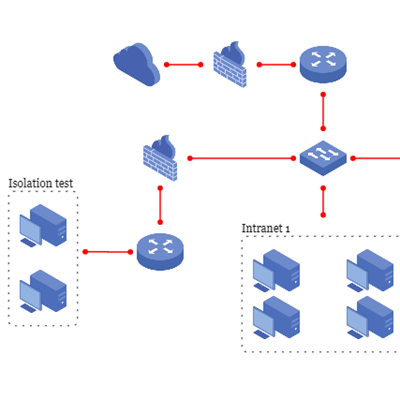
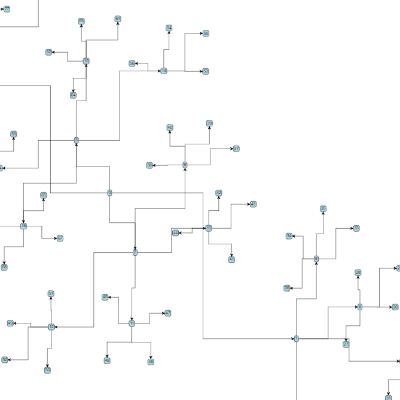
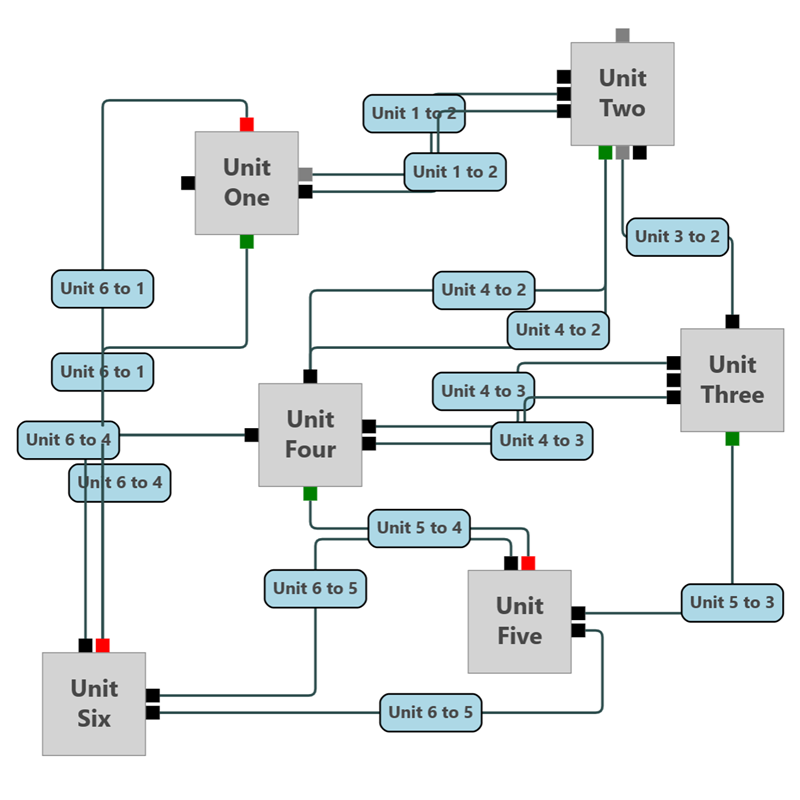
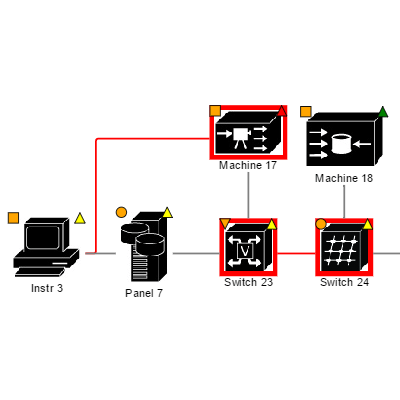
Network Editor
Shows a CISCO-style network configuration diagram, with the ability to group nodes into subnetworks.
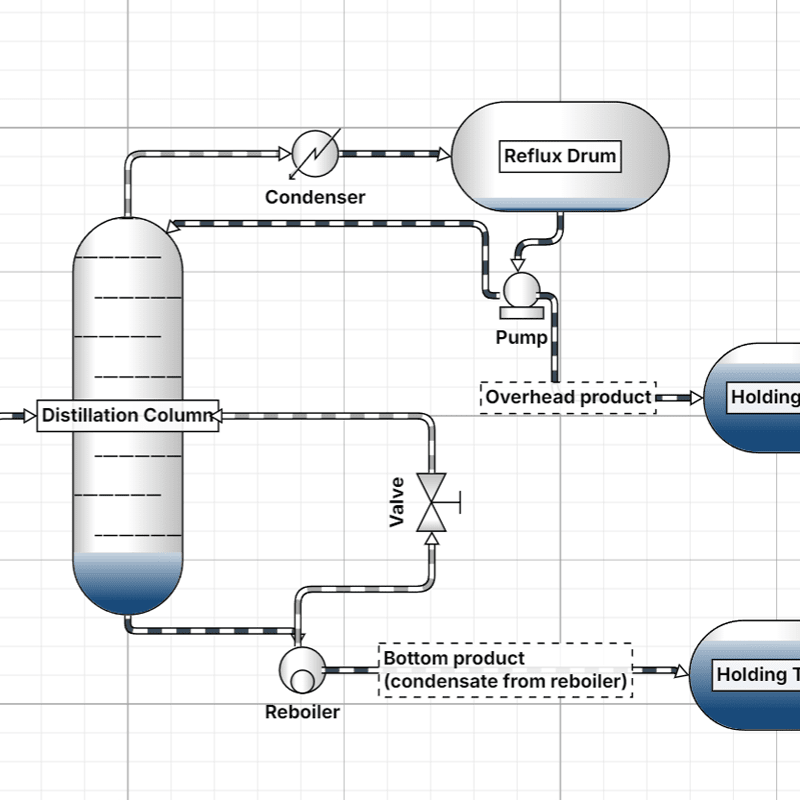
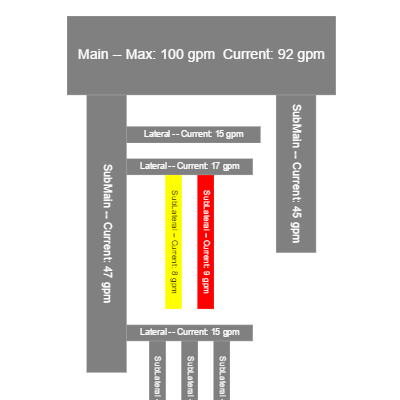
Process Flow
Industrial process flow diagram containing tanks, valves, and pipes, with animated flow in the pipes.
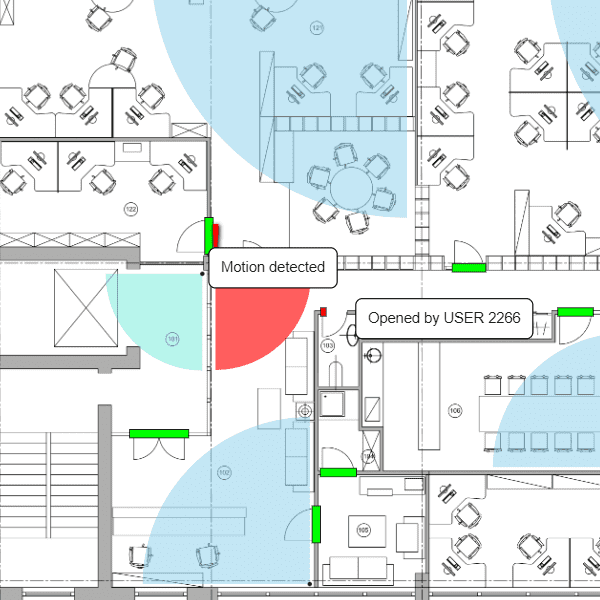
Security Monitor
Example of a security dashboard made with GoJS. Diagram for monitoring live video feeds and swipe access doors.
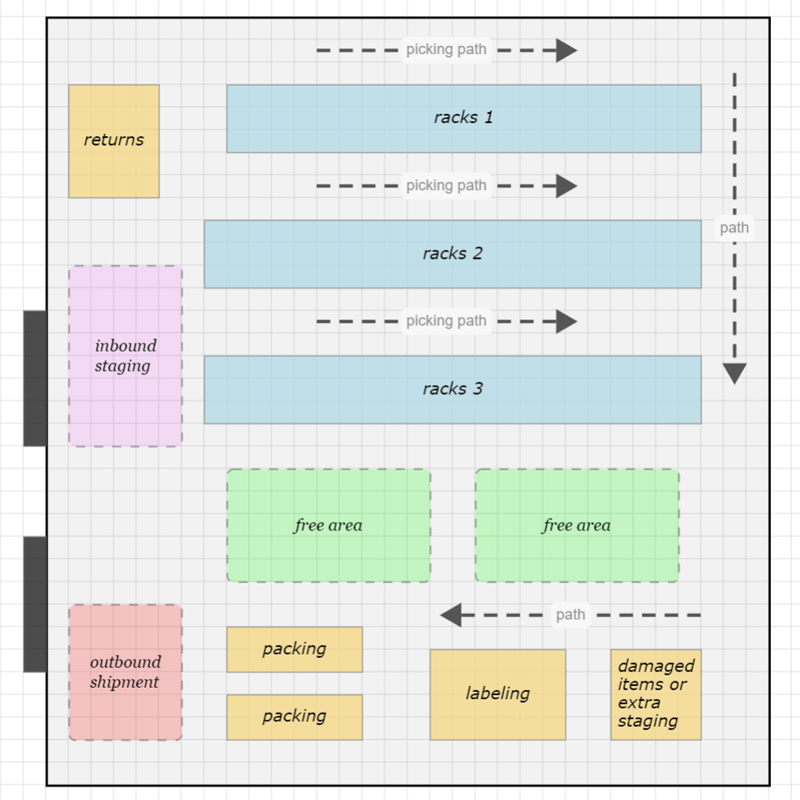
Warehouse Designer
Warehouse design diagram with reshapable areas and disconnected links.
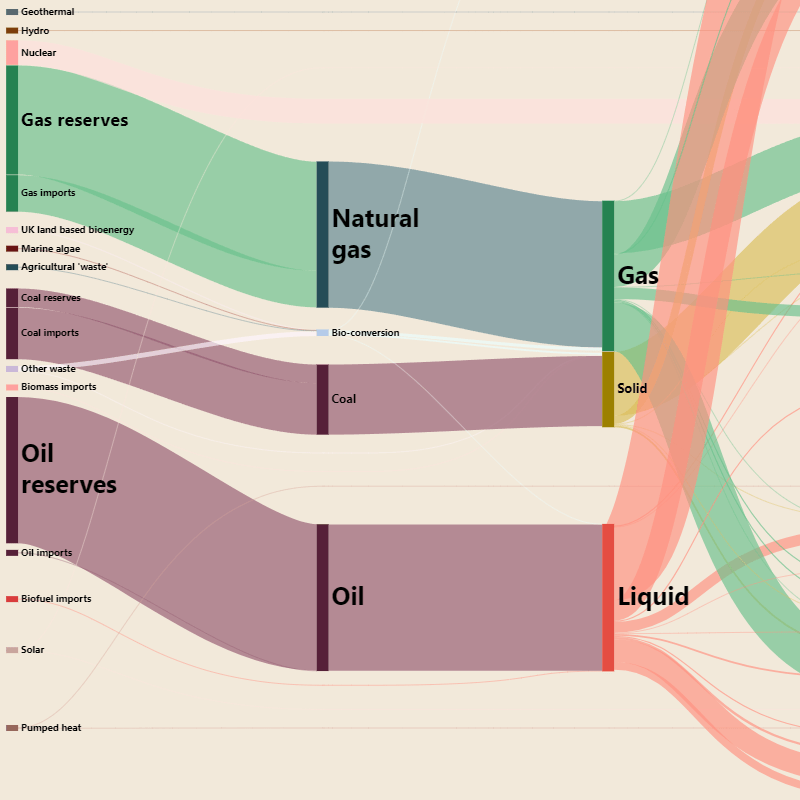
Sankey Diagram
Sankey diagrams show the amount of flow between nodes by the width of the links.
ARIA Accessibility
Demonstrates a customized CommandHandler to update a live HTML element for accessibility.
Dynamic Ports
Add ports to a selected node by clicking buttons or by using a context menu. Draw links by dragging between ports. If you select a link you can relink or reshape it.
Belts and Rollers
Show continuous belts winding by circular rollers
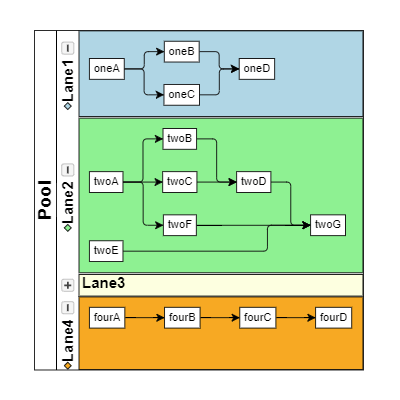
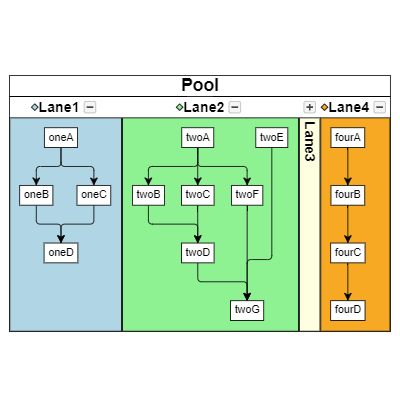
Swim Lanes
Demonstrates collapsible, resizable, re-orderable swimlanes, a kind of process-flow diagram, with custom dragging rules that disallow nodes from leaving their lane.
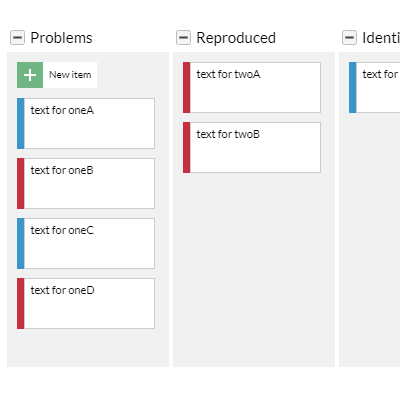
Kanban Board Editor
A Kanban board editor, allowing the categorization of editable tasks.
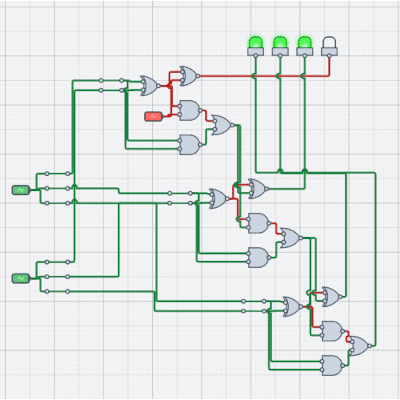
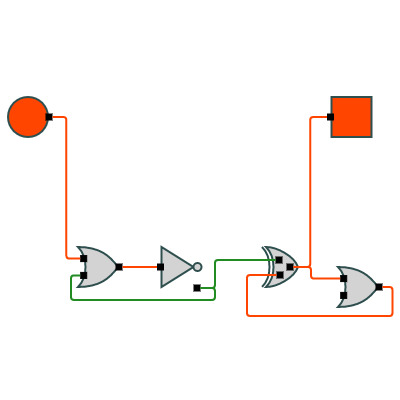
Logic Circuit
A functioning logic circuit diagram, which allows the user to make circuits using gates and wires.
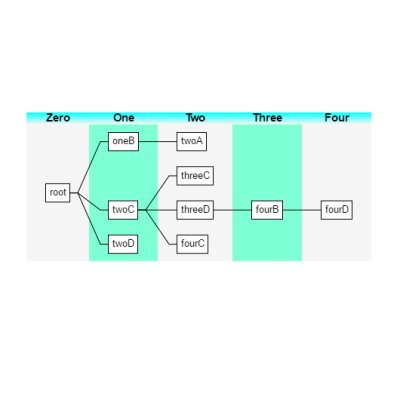
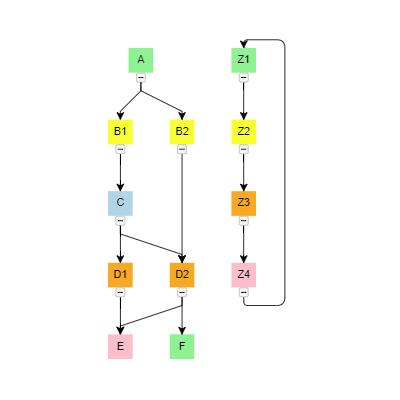
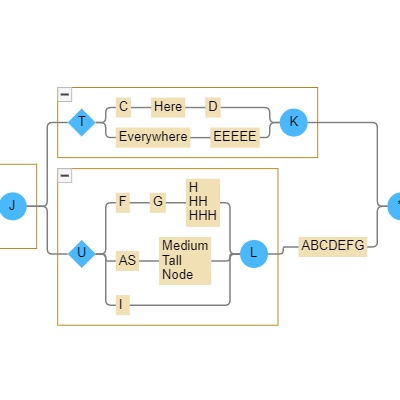
Layer Bands
Layer Bands are automatically created for each 'layer' of a TreeLayout, and run perpendicular to the layout.
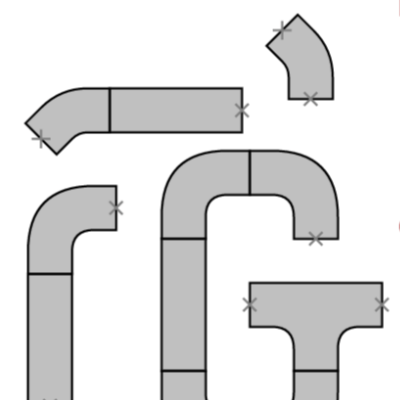
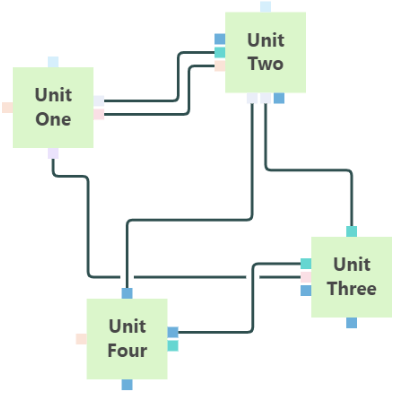
Pipes Diagram Editor
Showcasing nodes (Pipes) that can be joined, and will snap and drag together.
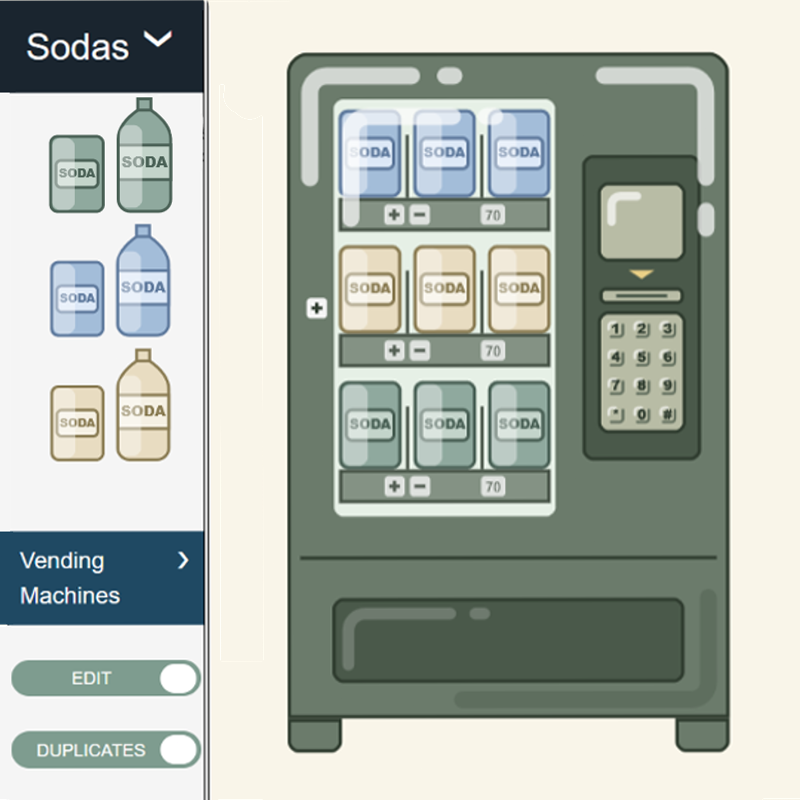
Vending Planogram
Drag and drop sodas from the Palette onto the vending machine. Use tools to edit the vending machine as well.

Production Process Editor
A designer for creating production process diagrams.
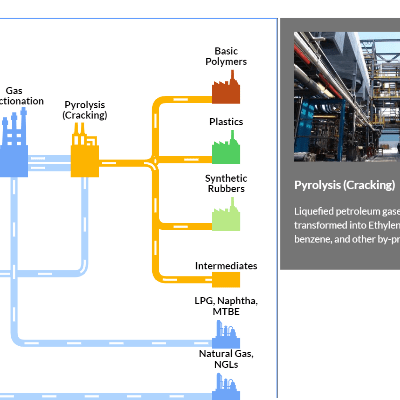
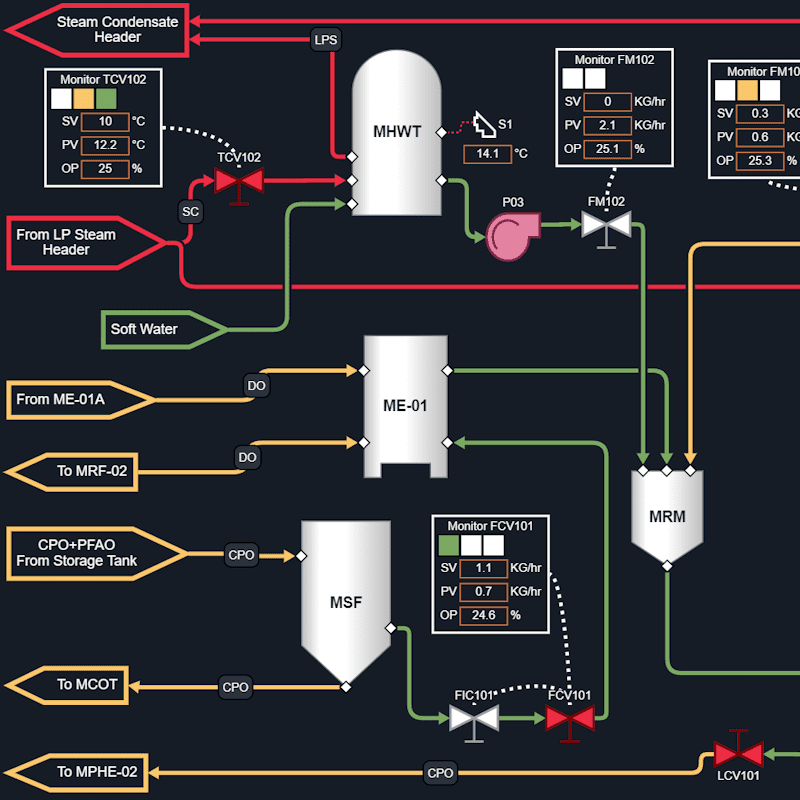
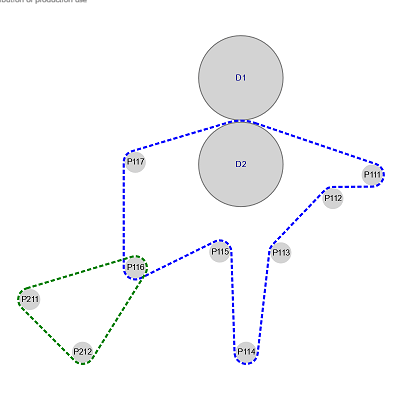
Production Process
Partially describes the production process for converting natural gas and oil byproducts into their end products.
Record Mapper
Displays a variable number of fields for each record, with links mapping one field to another.
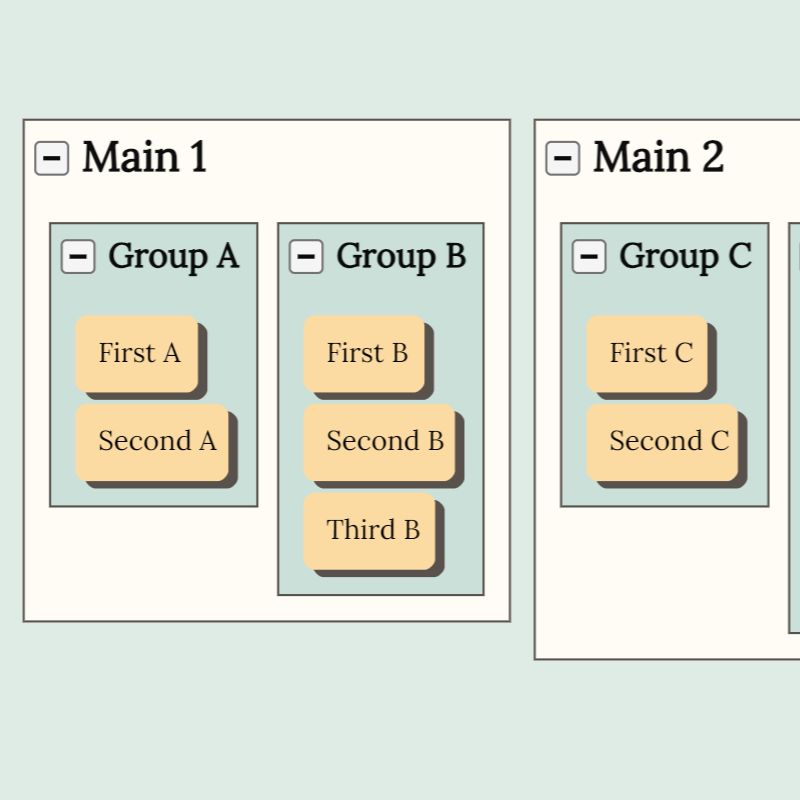
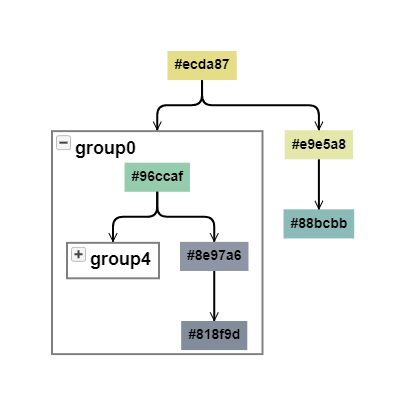
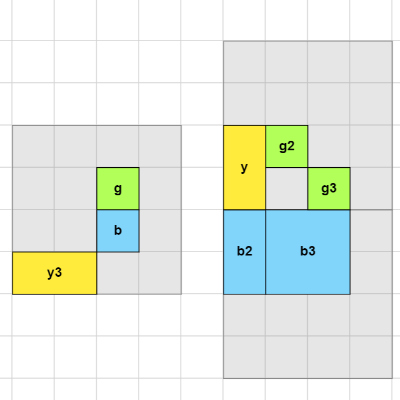
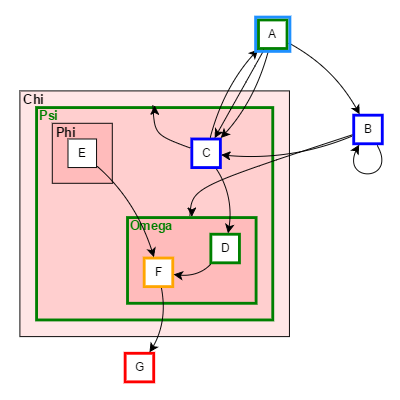
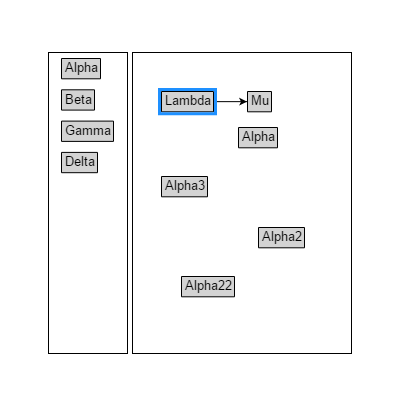
Regrouping Editor
Allows the user to drag nodes, including groups, into and out of groups, both from the Palette as well as from within the Diagram.
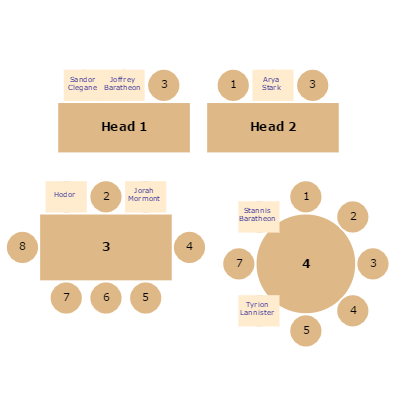
Seating Chart
This sample demonstrates custom logic in a GoJS diagram - a 'Person' node can be dropped onto a 'Table' node, causing the person to be assigned a position at the closest empty seat at that table.
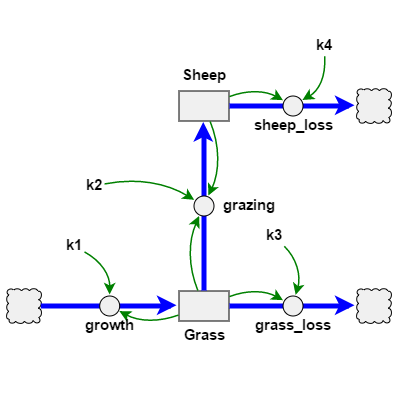
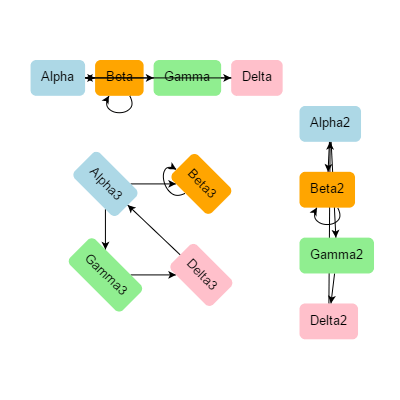
System Dynamics Diagram
A System Dynamics diagram shows the storages and flows of material in some system, and the factors that influence the rates of flow.
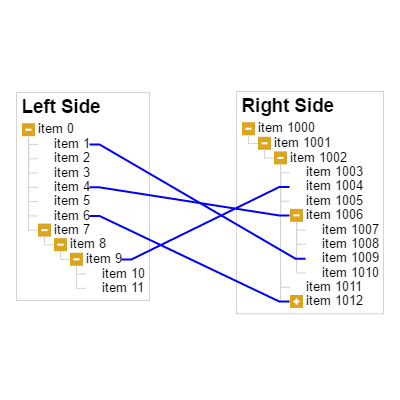
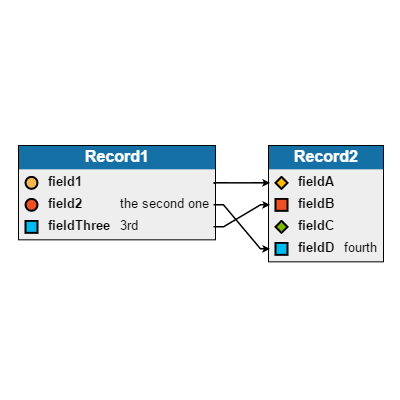
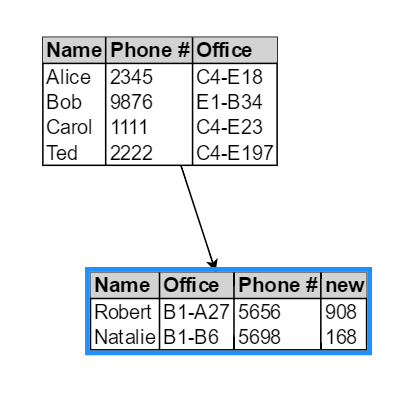
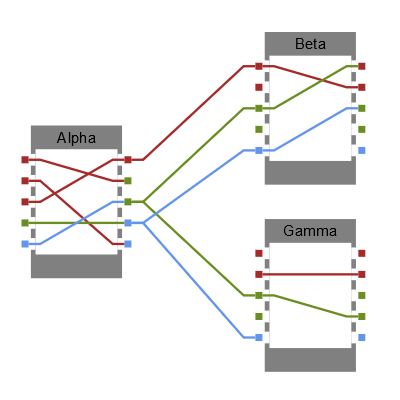
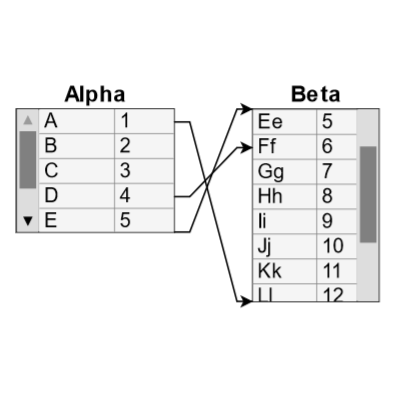
Tree Mapper
Displays two trees, allowing the user to dynamically draw or reconnect links mapping data from field to another.
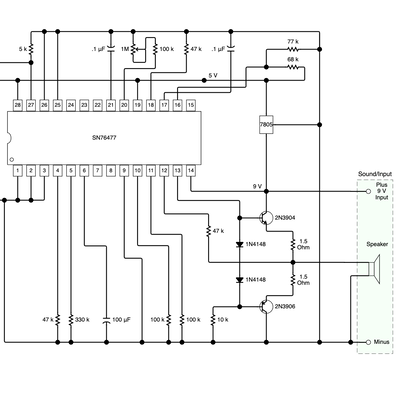
Circuit Designer
A diagram and palette of circuit componenets that allows for the creation of circuit schematics with manually shaped and routed links that save to a JSON model.
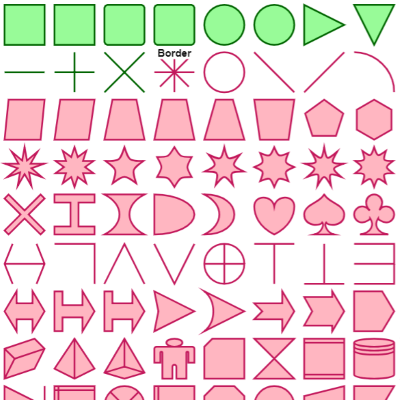
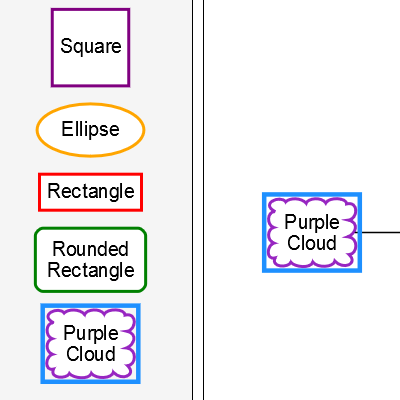
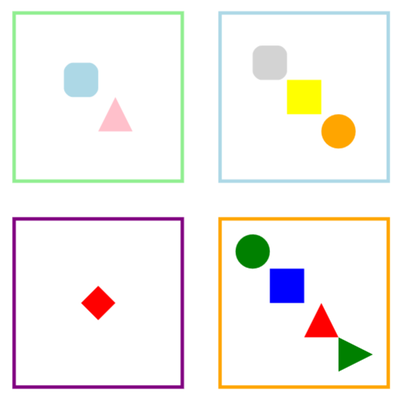
Shape Figures
Showcases all GoJS figures. You can define your own named Shape figures.
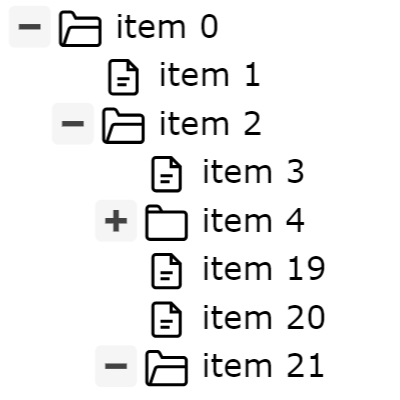
Tree View
Demonstrates a traditional 'Tree View' in a GoJS diagram, with optional orthogonal links between the nodes.
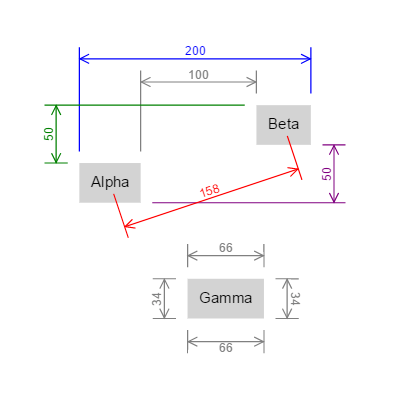
Dimensioning Links
Demonstrates custom Links that show the distance between two points.
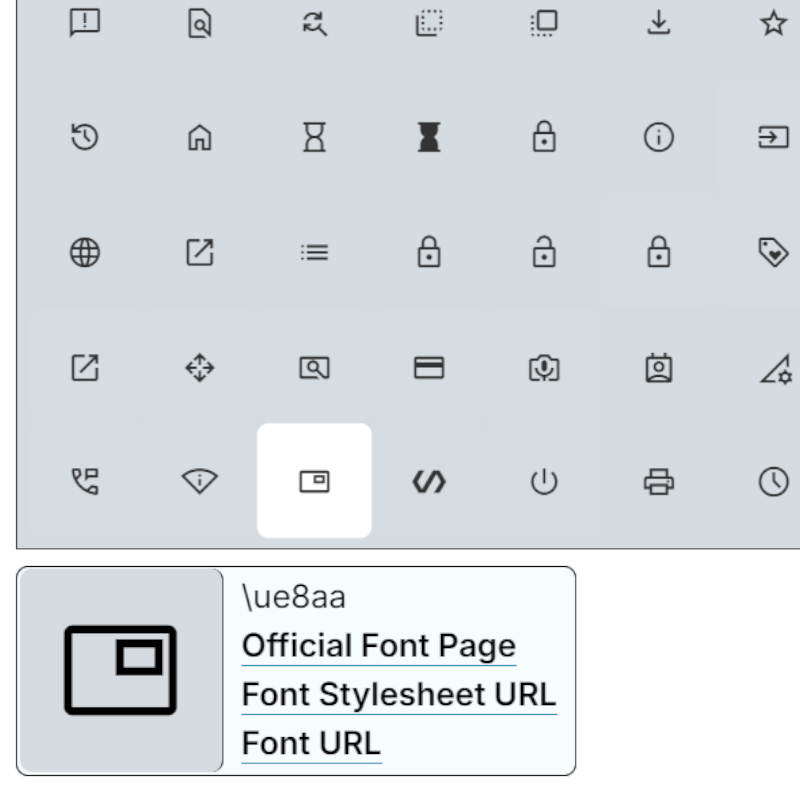
Font Icons
An example of how to use icon fonts with GOJS, making sure the fonts load fully before creating the diagram.
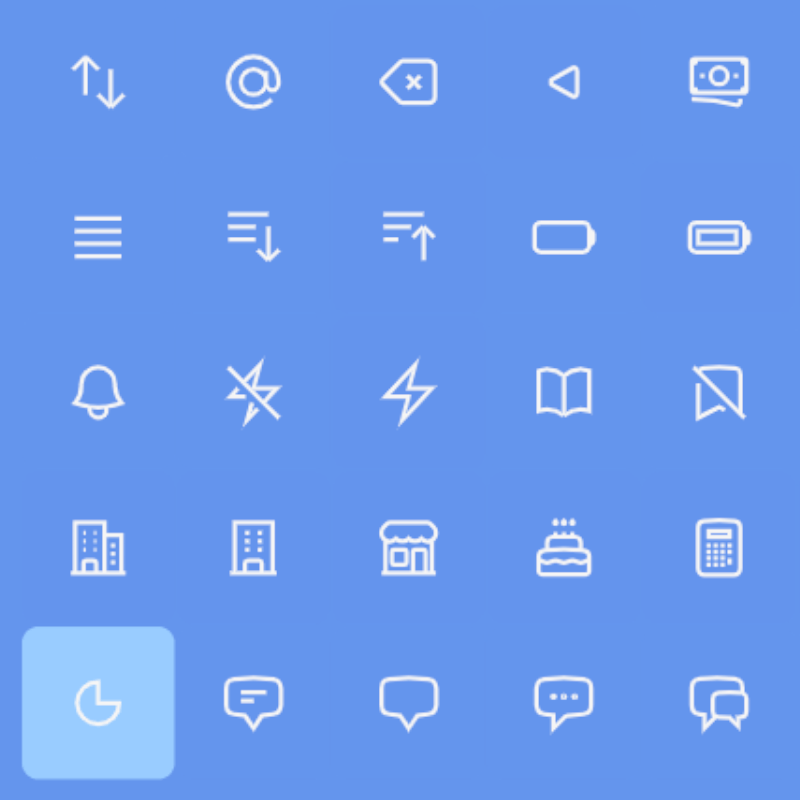
SVG Icons
Create your own custom Shapes using SVG path strings. This sample uses SVG strings from a free icon set.
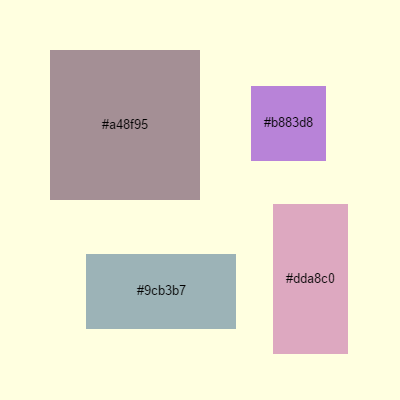
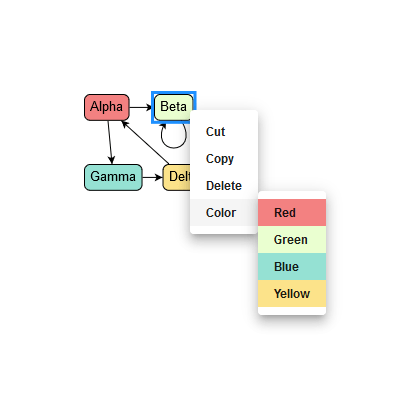
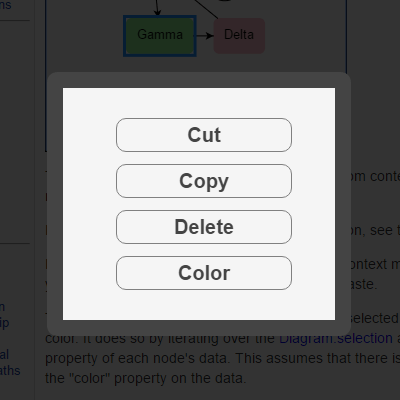
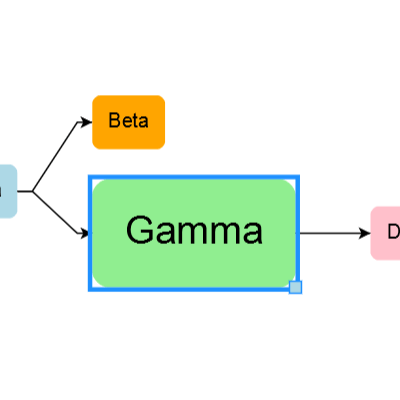
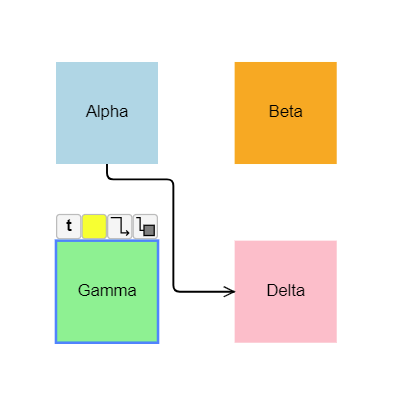
Block Diagram Editor
A simple block diagram editor that makes it easy for the user to chain together new nodes, with context menus for changing shapes and colors.
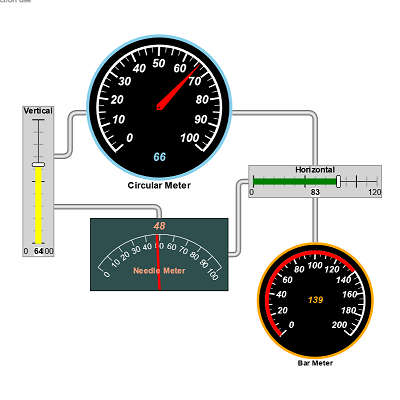
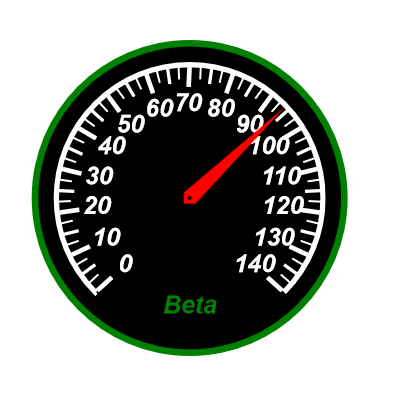
Meters and Gauges
Various meters and gauges that show particular values and can be modified by the user by dragging.
Path Finder
GoJS diagram demonstrating the versatility of the available tools. Using the avoid nodes link router to give nodes path finding for navigating through a house with fluid movements from animations.
Absolute Positioning
A diagram that does not scroll or zoom or allow parts to be dragged out of a fixed area.
Add/Remove/Swap Columns in Table Panels
Demonstrates adding and removing and swapping columns of a Table Panel.
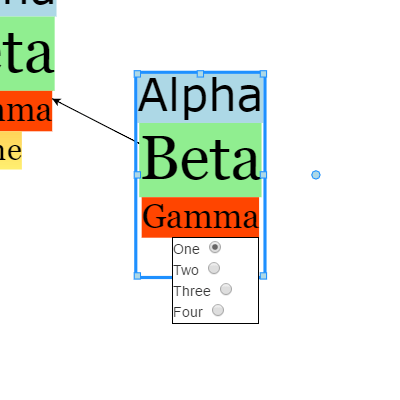
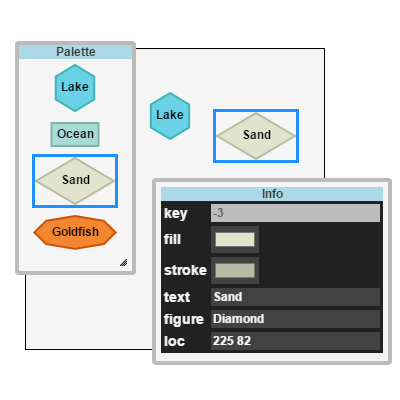
Adding Node to Palette
Select and edit a node and add a copy of it to the palette.
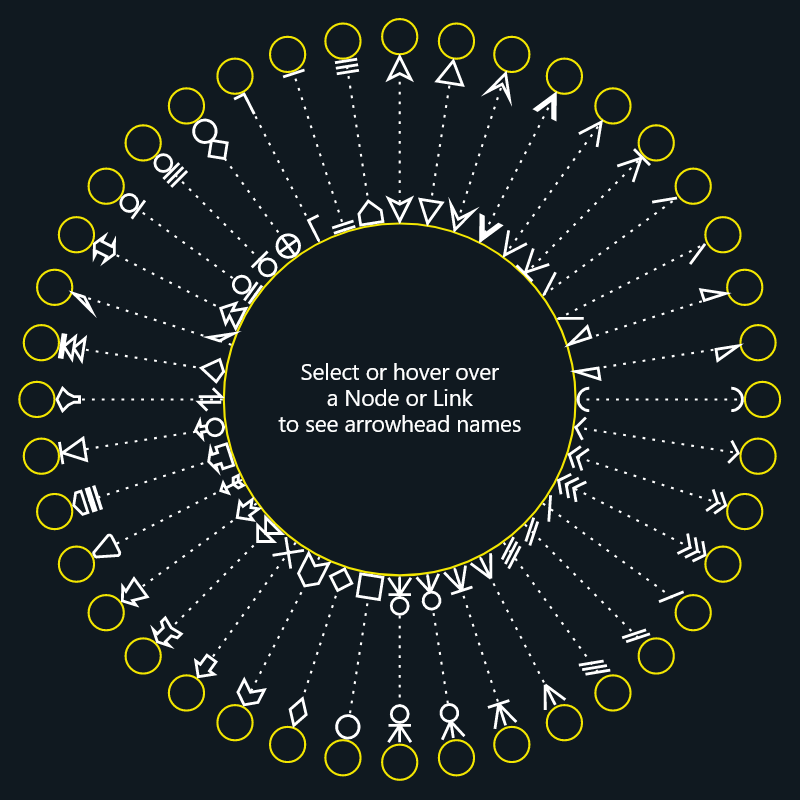
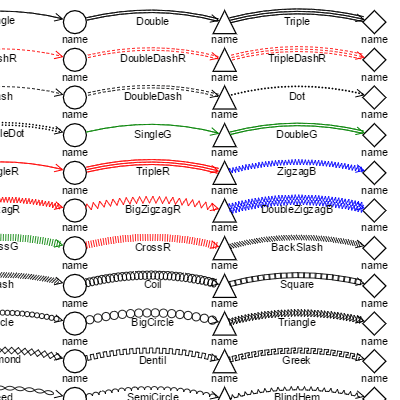
All Predefined Arrowheads for Links
Showcases all pre-defined Link arrowheads. You can define your own named arrowhead geometries.
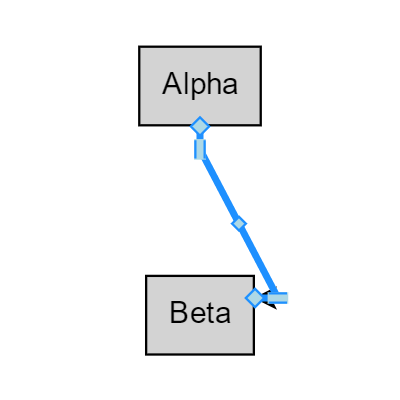
Draggable Link
Showcases draggable disconnectable links that can be connected by dropping one or both ends at a valid port.
Animated Node Attention
Aninmated focus by scrolling to a node along with animation of the size of the node to draw attention to it..
Animation of Tokens along Link Paths
Animation of diagram parts (tokens) along link paths.
Arranging Layout
The Arranging layout is a layout of layouts, plus a third layout for arranging left-overs.
Avoids Links Router
A custom Router that moves Link segments to parallelize and avoid overlaps.
Ballon Links
Demonstrates custom Links that create a 'Balloon' around the fromNode.
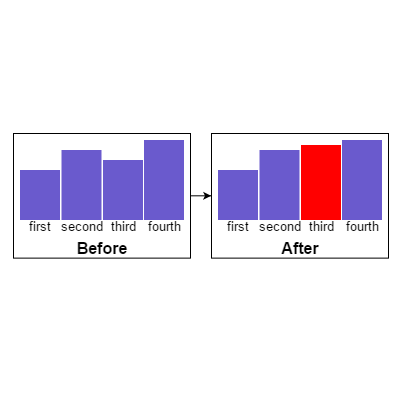
Bar Charts in Nodes
Simple bar charts or histograms within nodes.
Basic with ToolTips and Context Menus
Shows many of the commands possible in GoJS, templates for Links and for Groups, plus tooltips and context menus for Nodes, for Links, for Groups, and for the Diagram.
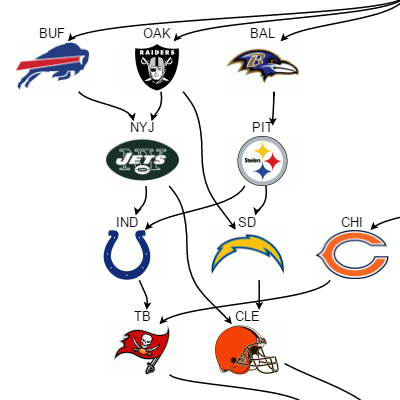
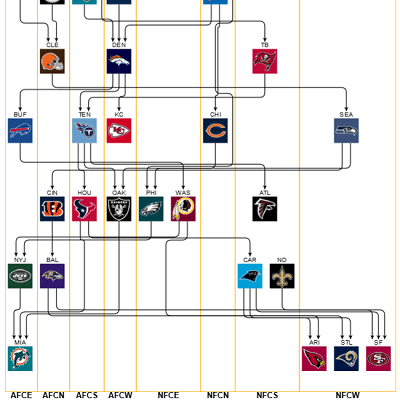
Beat Paths
Demonstrates reading JSON data describing the relative rankings of NFL teams at a particular moment in time and generating a diagram from that data.
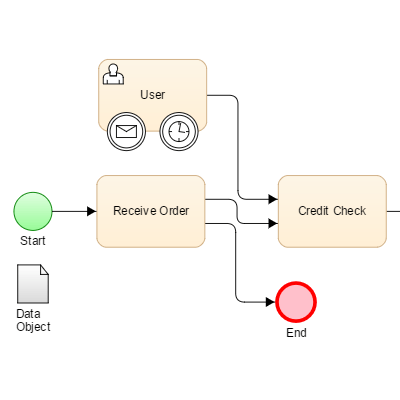
BPMN Editor
The start of a Business Process Model and Notation editor.
Buttons Shown on Hover
Shows buttons in an Adornment upon hover over a node.
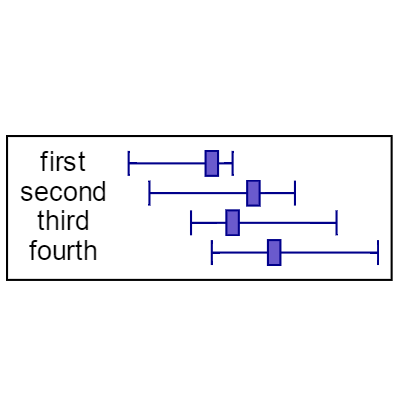
Candlestick Charts
Simple candlestick or range charts within nodes.
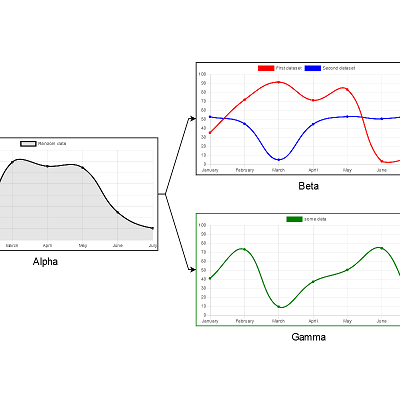
Chart.js Charts in Nodes
Shows how to render a data-driven chart within each Node using the Chart.js library.
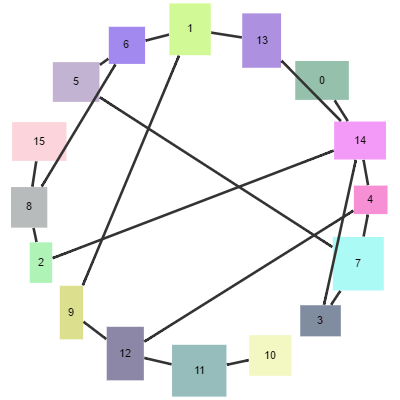
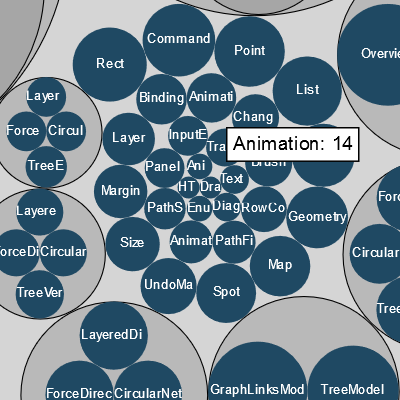
Circular Layout Demo
Shows CircularLayout and options. This layout positions nodes in a circular arrangement.
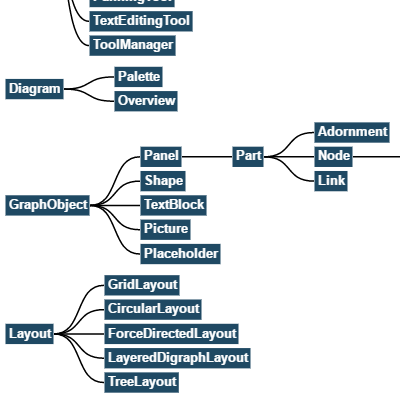
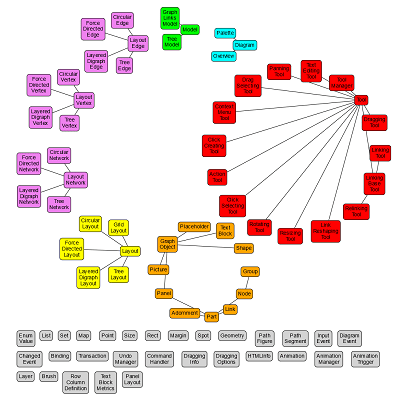
Class Hierarchy Diagram
Displays the GoJS Class Hierarchy as a series of trees. Double-click to go to the class's API documentation.
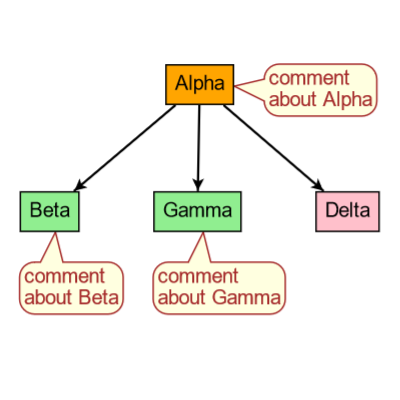
Comment Nodes
GoJS supports the notion of 'Comments', including the ability to create balloon-like comments.
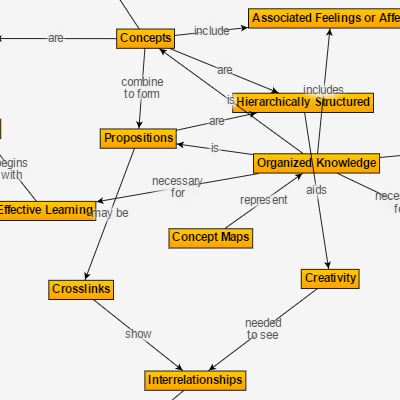
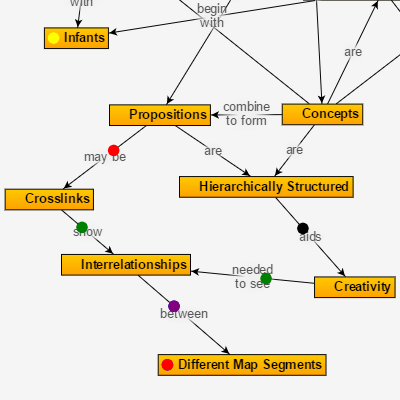
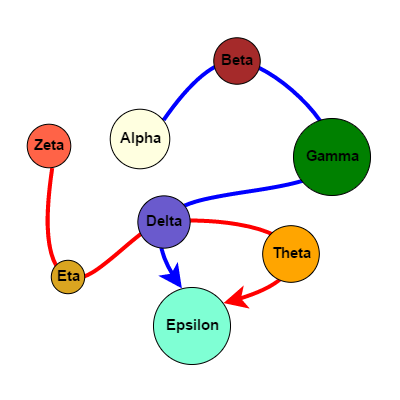
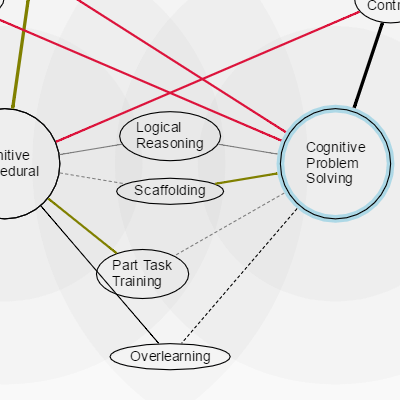
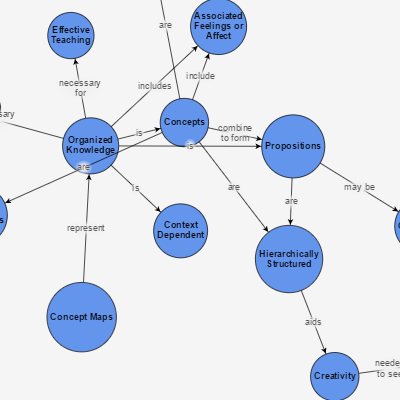
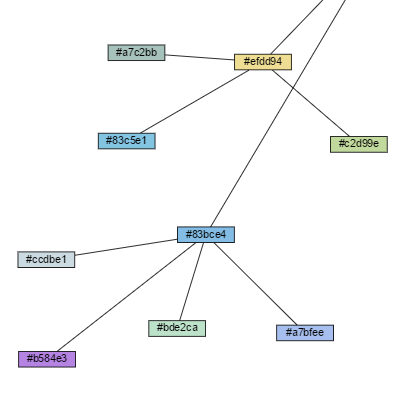
Concept Map
A web of interlinked concepts displayed with a ForceDirected Layout, showcasing link labels.
Connecting Links to Links Using Link Label Nodes
Demonstrates the ability for a Link to appear to connect with another Link, using label nodes that belong to links.
Connection Box Editor
A Node containing ports that allow linking between them, within the node as well as between nodes, with custom link validation.
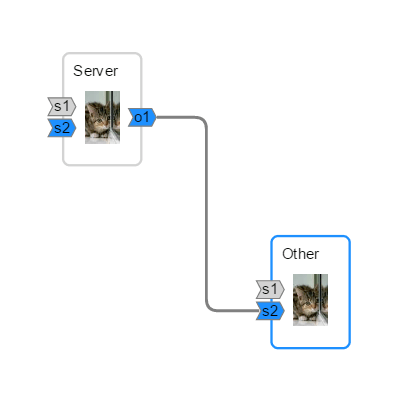
Constant Size Nodes While Zooming in or out
Kitten Monitor with constant size markers and tooltips when zooming out.
Content Alignment Demo
Showcases alignment properties of the Diagram.
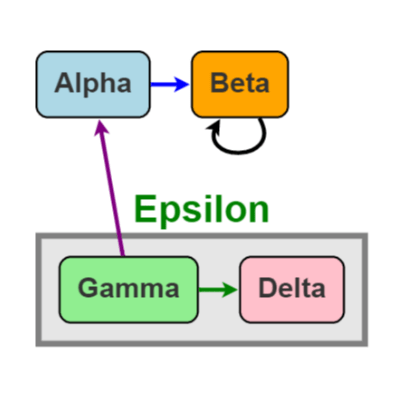
Grouping
Demonstrates subgraphs that are created only as groups are expanded.
Curved Link Reshaping Using Single Handle
A custom Tool that lets the user reshape curved links with a single handle.
Curved Multi-Node Path Link Routes
Demonstrates custom routing for Links running through other Nodes.
Custom Animations Loading Tree
Shows how to create a custom Diagram loading animation.
Custom Expand/Collapse
Shows how to create Buttons with custom behavior for expanding/collapsing of a graph.
HTML Context Menu
Demonstrates the implementation of a custom HTML context menu.
Parallel Routing
Demonstrates custom Links that route parallel to other Links between the same two ports.
Custom Node Animations
Shows how to create several custom Node animations.
Custom Panel Layout: Cascading Elements
Shows how to create a custom PaneLayout.
Custom Text Editors
Demonstrates using a custom HTML element for in-place editing of a TextBlock.
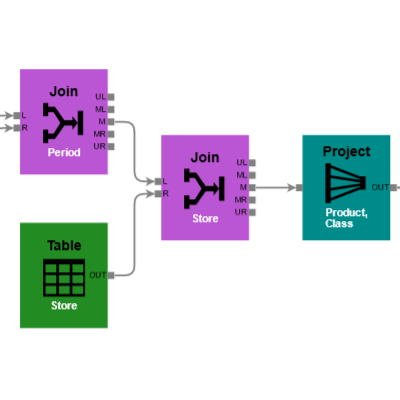
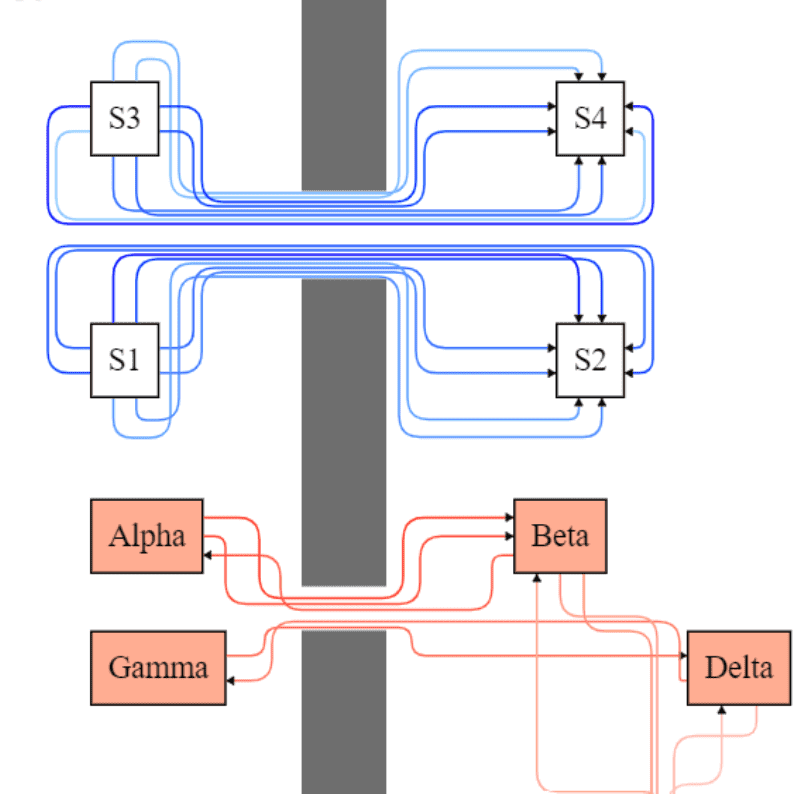
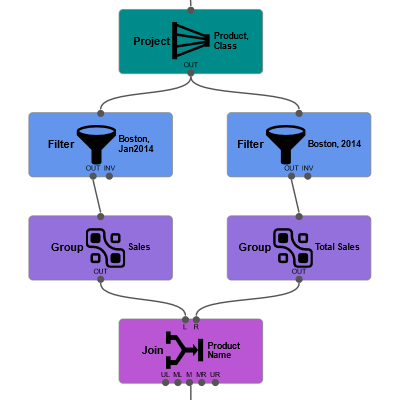
Data Flow Diagram
Show the processing steps involved in a database transformation or query, with labeled ports.
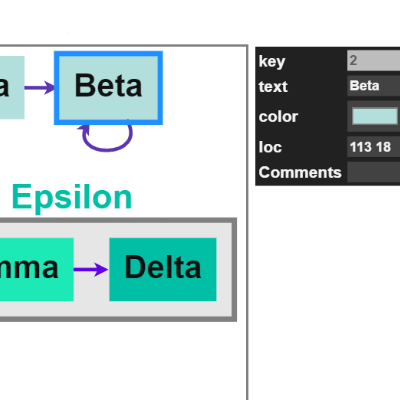
Data Inspector
A simple drop-in for inspecting and editing Part data.
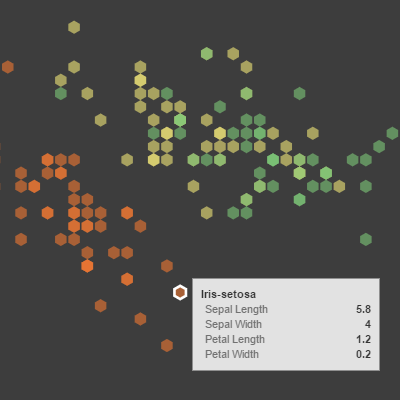
Data Visualization
A data-visualization demonstration that showcases GoJS interacting with other elements on the page.
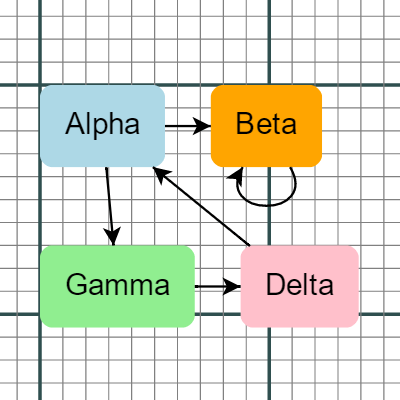
Diagram Scroll Modes
Shows infinite scrolling and positionComputation.
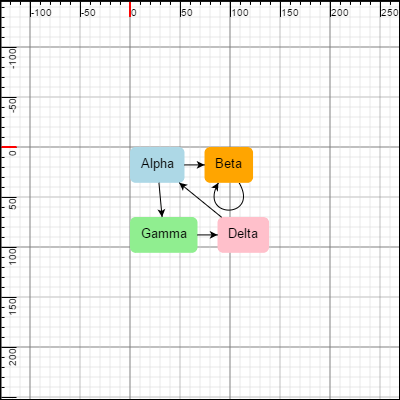
Diagram with Rulers
A diagram with Graduated Panels at the edges acting as rulers.
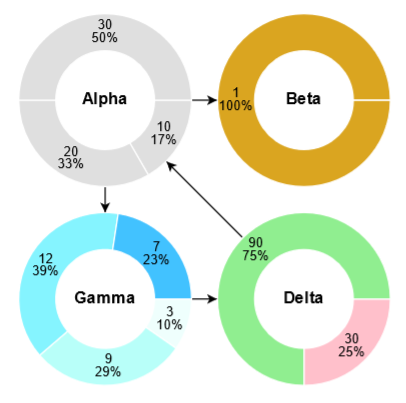
Donut Charts in Nodes
Ring-shaped pie charts within nodes.
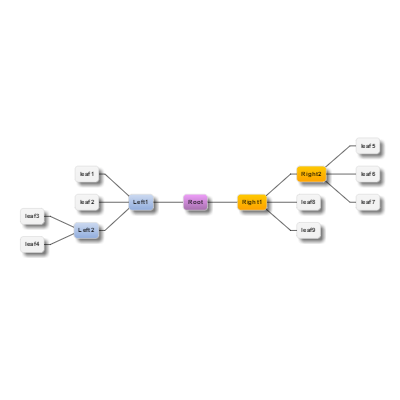
Double Tree
Displays a single diagram of two trees sharing a single root node growing in opposite directions, using the DoubleTreeLayout extension.
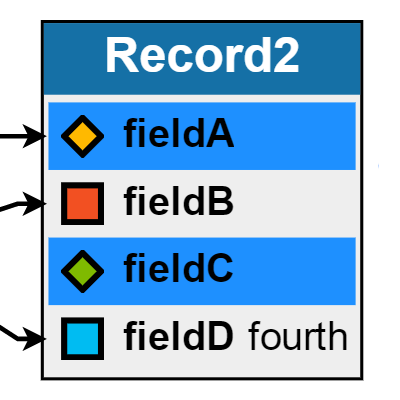
Drag and Drop Fields Between Nodes
Drag and drop fields from/to record Nodes.
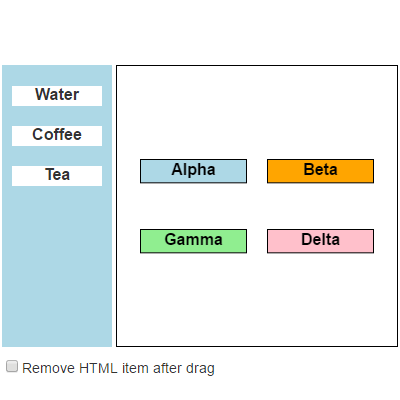
Drag and Drop From HTML Element to Diagram
Demonstrates dragging and dropping from HTML, and pasting from the external clipboard.
Drag Creating Tool
A custom Tool that lets a user draw a box showing where and how large a new node should be.
Drag Fields Out of Diagram to HTML Element
Drag out fields from record Nodes to an HTML element.
Drag Zooming
A custom Tool that lets a user draw a box showing what to zoom in to.
Two Diagrams Drag-and-Drop
Demonstrates drag and drop between two different diagrams using a shared UndoManager.
NonRealtime Dragging
A custom DraggingTool that lets the user drag a translucent image of the Nodes and Links to be moved, leaving them in place until the mouse up.
Dragging Node Label
A custom Tool that lets the user drag a label in a Spot Panel of a Node.
Dragging Link Label
A custom Tool that lets the user drag a label on a Link and that keeps its relative position to the link.
Dragging Link Label along Path
A custom Tool that lets the user drag a label on a Link and that keeps the label along the path of the link.
Draw Command Handler
Demonstrates custom CommandHandler which provides alignment commands and additional behaviors for the arrow keys.
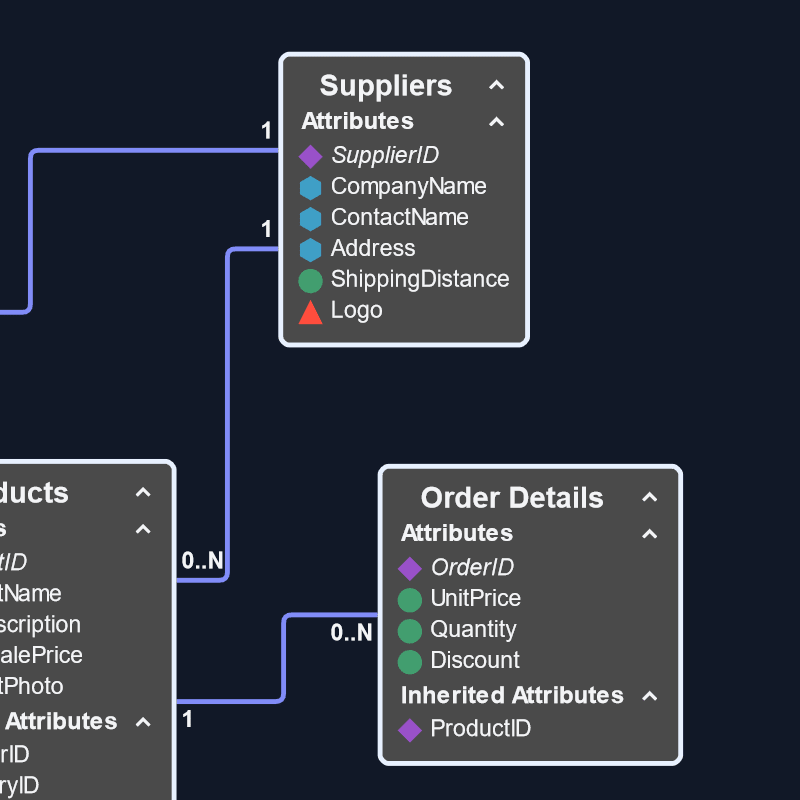
Entity Relationship Diagram
An entity relationship diagram, showcasing data binding with item arrays.
Euler Diagram
A read-only diagram where clicking on a node will open a new webpage.
Incremental Tree
Demonstrates the expansion of a tree where nodes are only created 'on-demand', when the user clicks on the 'expand' Button.
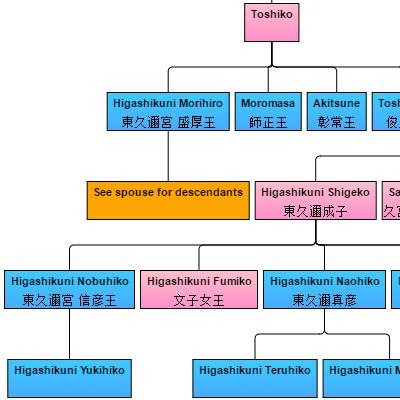
Family Tree Diagram, Japanese
Shows a standard family tree.
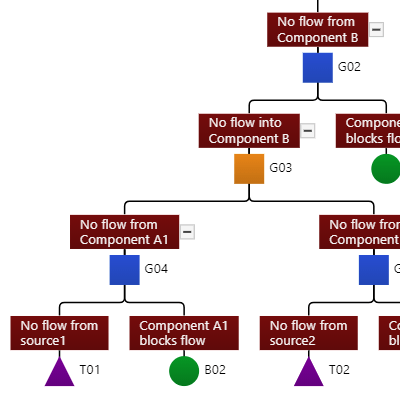
Fault Tree Analysis
A fault tree diagram with collapsing/expanding subtrees and gates at each non-root node.
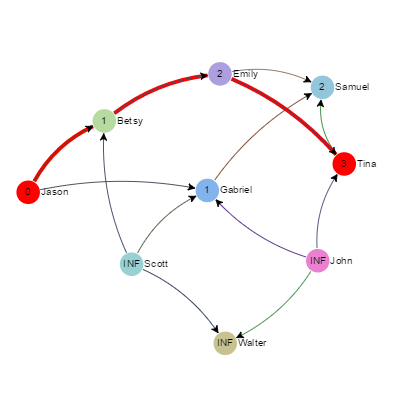
Distances and Paths
Show distances between two nodes and highlights one of all possible paths between the nodes.
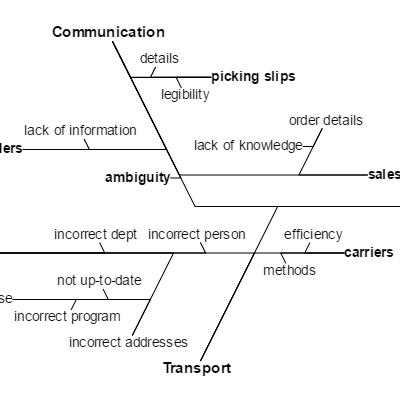
Fishbone Layout
The Fishbone or Ishikawa layout is a tree layout for cause-and-effect relationships.
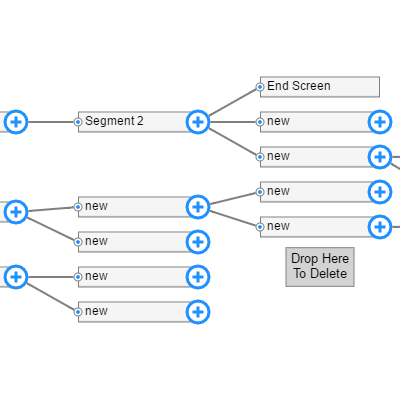
Flow Builder for Building Acyclic Graphs
Demonstrates a flow builder where nodes/links can be created or dropped onto a recycling node.
Flow Layout in Panels
A custom PanelLayout that arranges panel elements into rows or columns.
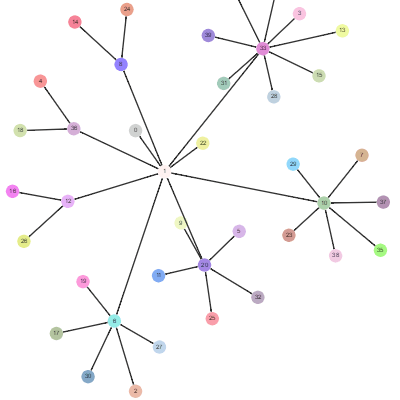
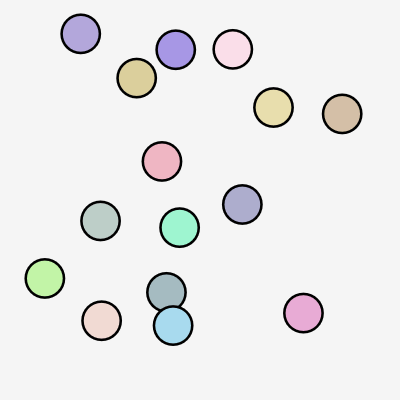
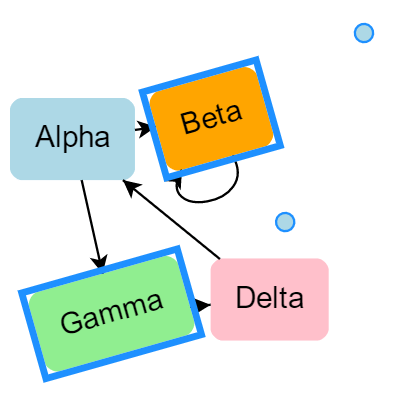
Force Directed Layout Demo
Shows ForceDirectedLayout and options. Treats the graph as if it were a system of physical bodies with forces acting on them and between them.
Freehand Drawing
A custom Tool that lets the user interactively draw a line, converting it into a Shape.
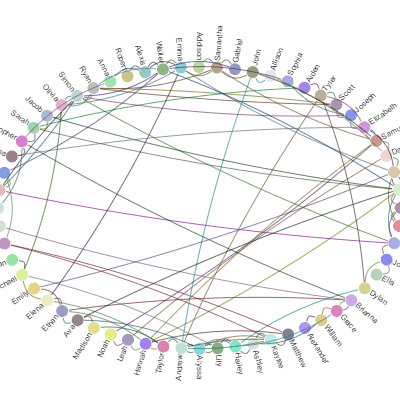
Friend Wheel
Demonstrates a customized CircularLayout.
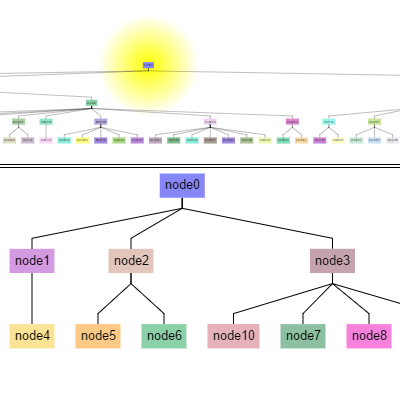
Diagram and Local View
Two diagrams, the one on top showing a full tree and the one below focusing on a specific node in the tree and those nodes that are logically 'near' it.
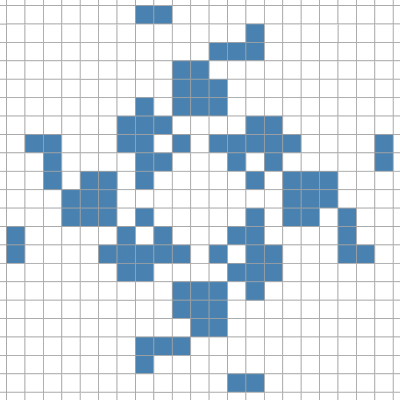
Game of Life Cellular Automation
A cellular automation simulation.
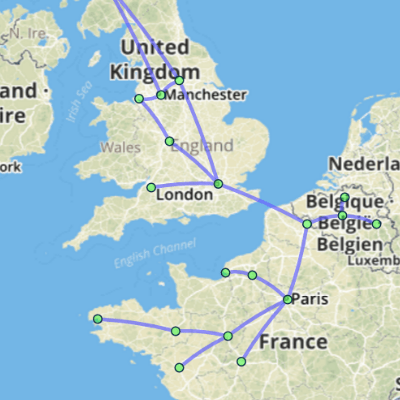
Diagrams and Leaflet.js
A GoJS diagram atop a Leaflet.js map, with nodes placed at latitude and longitude based locations.
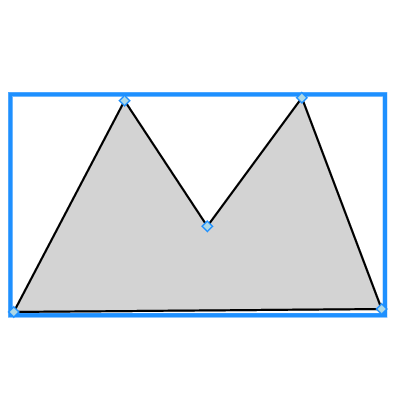
Geometry Reshaping
A custom Tool that supports interactive reshaping of Geometries.
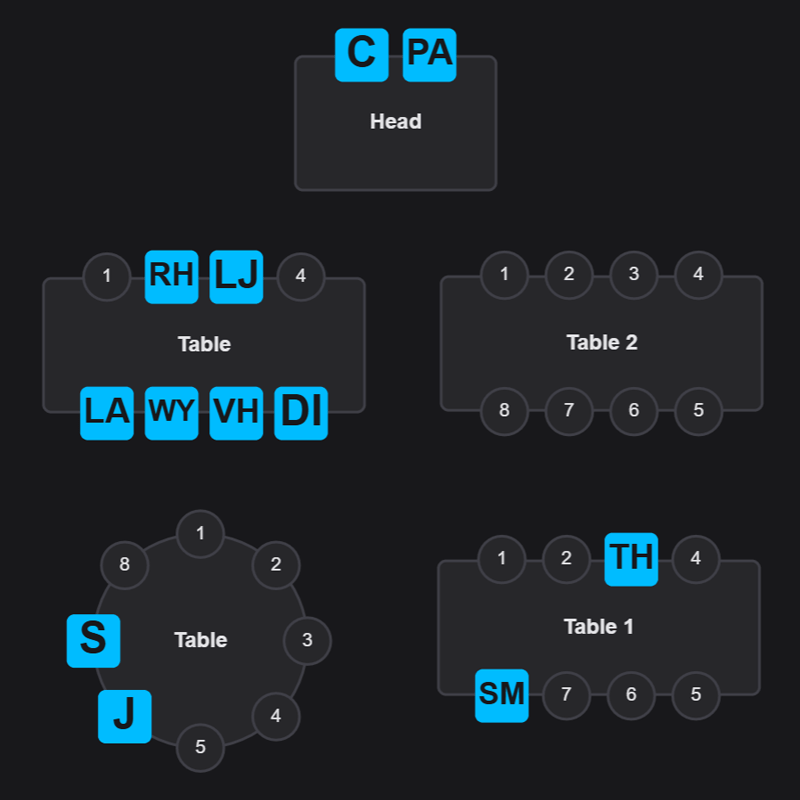
GoJS Seating Chart Creator
A seating chart demo app built with GoJS and Vue
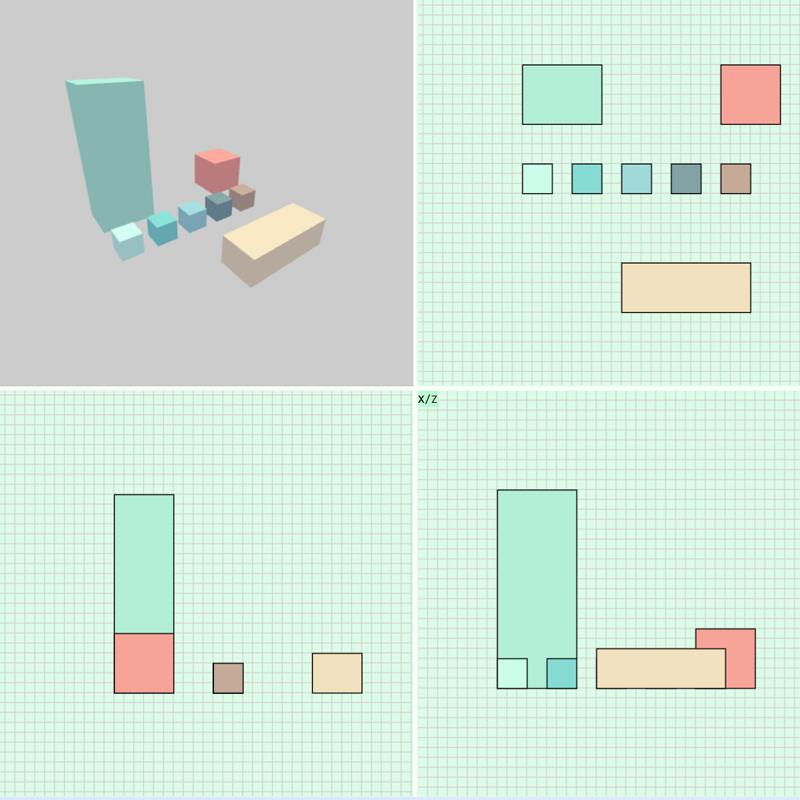
GoJS with 3D
A three-dimensional viewer demo app built with GoJS, ThreeJS, and Svelte
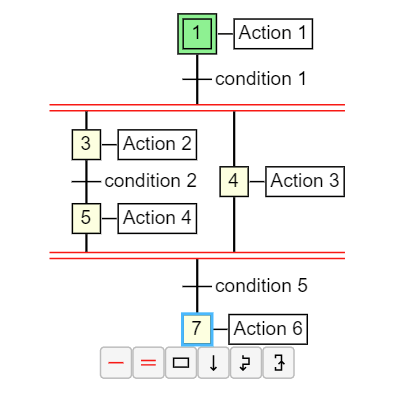
Grafcet Diagram Editor
A Grafcet is a kind of sequential function chart used in automation design.
Grid Layout Demo
Shows GridLayout and options. Places all of the Parts in a grid-like arrangement, ordered, spaced apart, and wrapping as needed.
Groups with Rounded Headers and Footers
Groups consisting of a RoundedTopRectangle and a RoundedBottomRectangle figure surrounding the Group's Placeholder.
Guided Dragging
A custom DraggingTool that makes guidelines visible as a Part is dragged around a Diagram and is nearly aligned with another Part.
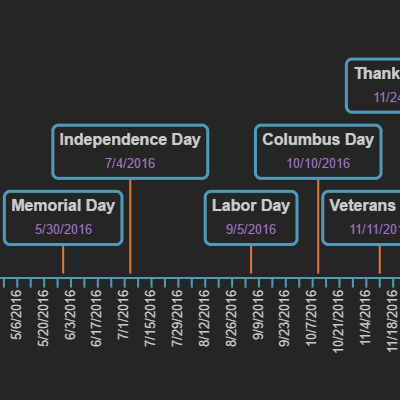
Timeline
A simple timeline with events arranged along a line.
HTML Interaction
Contains two draggable HTML elements (using jQuery UI). One of the two HTML elements houses a panel that interacts with the main Diagram.
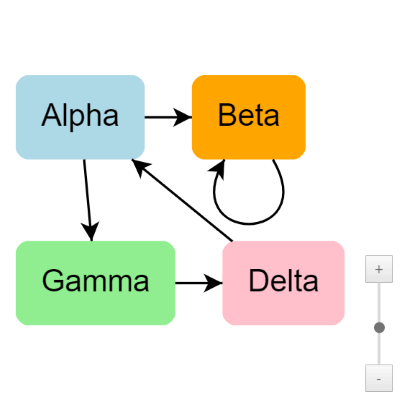
HTML Zoom Slider for Zooming
Demonstrates use of the ZoomSlider class to zoom in/out using a control.
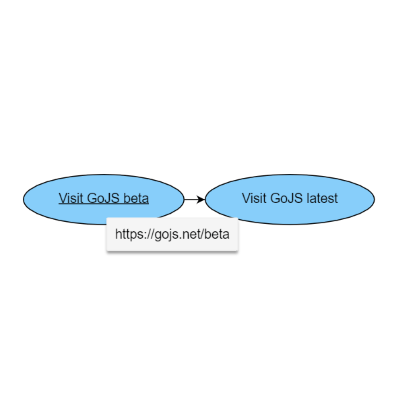
Hyperlink Text
Demonstrates usage of the HyperlinkText extension.
Instrument Gauges
A gauge using a scale made with a Graduated Panel.
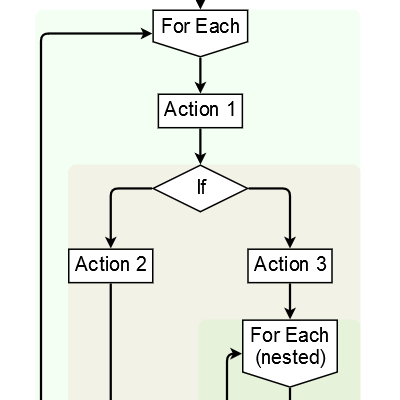
Flowgrammer Visual Editor
Demonstrates a flow-chart-like editor of a restricted syntax language. Uses the ParallelLayout extension.
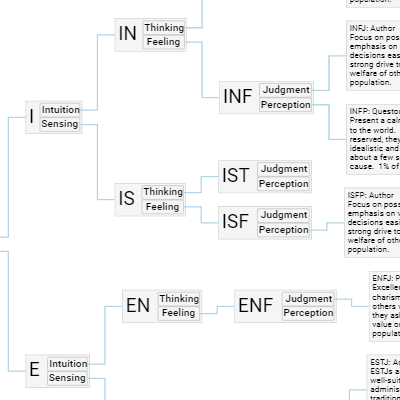
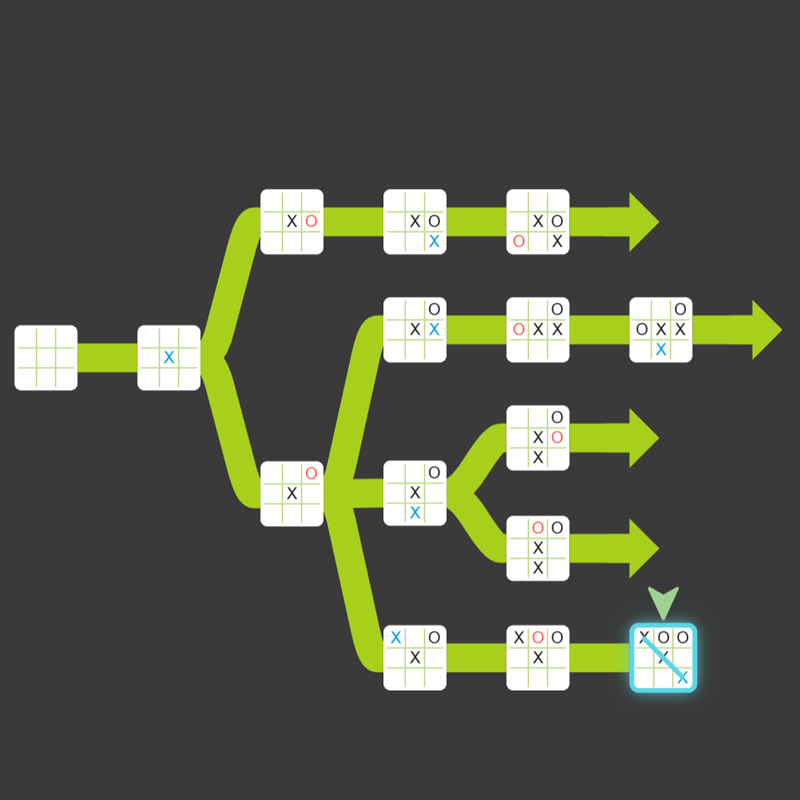
Decision Tree
Allows a user to make progressive decisions.
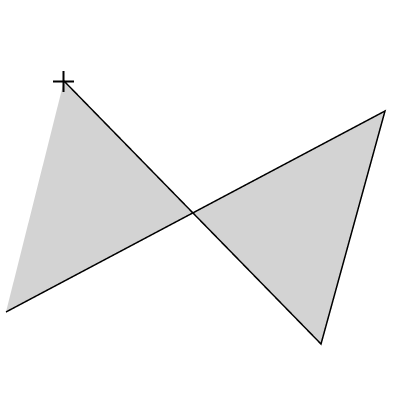
Interactive Drawing of Polygons or Polylines
A custom Tool that lets the user interactively draw polygons and polyline Shapes.
Continuous Interactive Force Layout
A continuous ForceDirectedLayout that occurs as the user drags around a node.
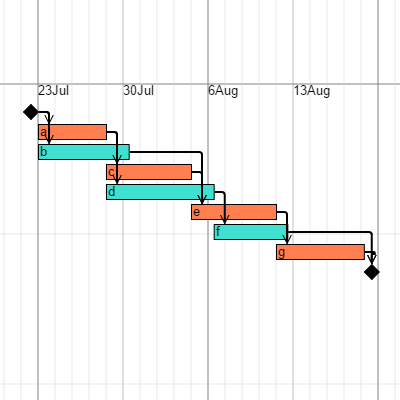
Gantt Chart
Demonstrates a Gantt chart with a collapsible tree of tasks
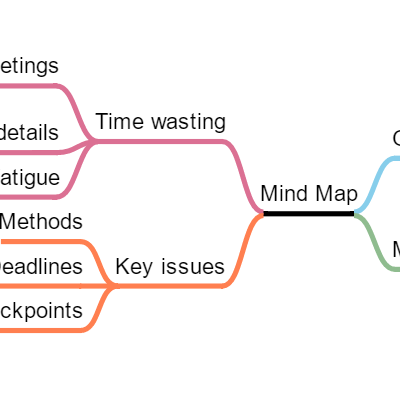
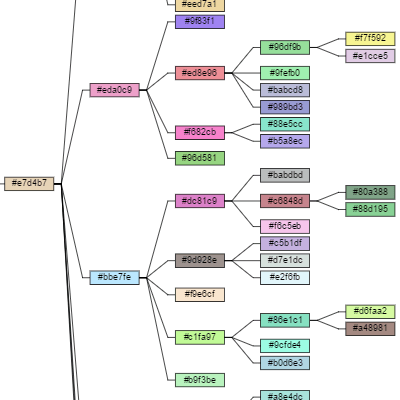
Mind Map Editor
A Mind Map, a double-tree whose nodes have an 'add' button when selected and a context menu.
Interactive React Diagram
A GoJS Diagram component in React
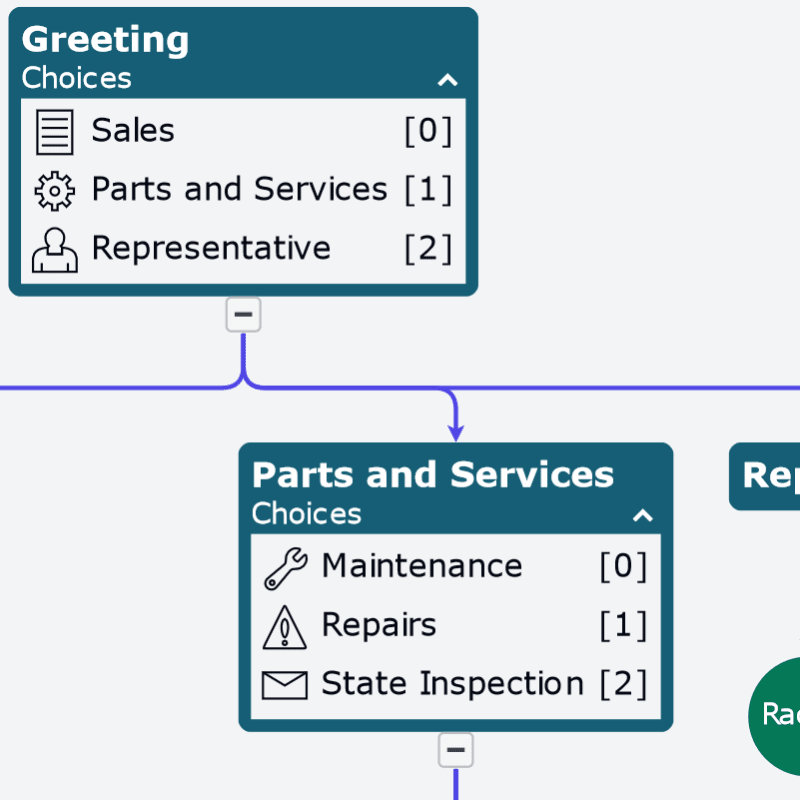
IVR Tree Diagram
Diagram representation of an Interactive Voice Response Tree (IVR tree). Nodes may have a collapsible list of details.
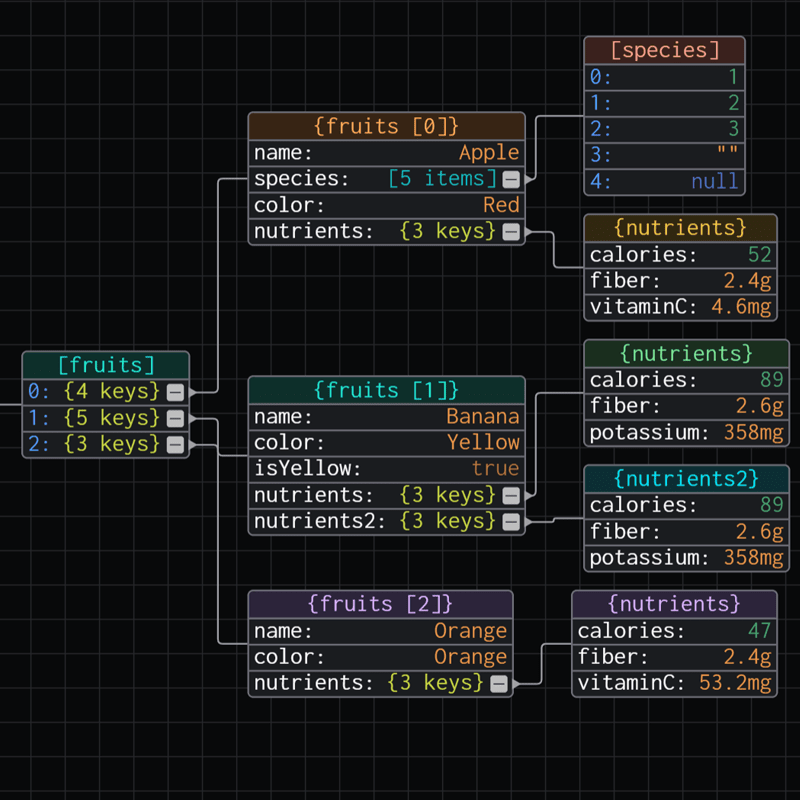
JSON Diagram editor
A Demo using GoJS, Monaco, and Svelte to create an editable JSON Diagram
Lasso Selecting
A custom Tool that replaces the standard DragSelectingTool to allow the user to draw a lasso around the Parts they want to select.
Layered Digraph Layout Demo
Shows LayeredDigraphLayout and options. Arranges nodes of directed graphs into layers (rows or columns).
Parallel Layout
A custom Layout that assumes there is a single split and a single merge node with parallel lines of nodes connecting them.
LightBox Style HTML Context Menu
Shows a LightBox style HTML Context Menu.
Drag Unoccupied
Demonstrates a function to avoid any overlapping of nodes during dragging.
Polyline Linking
A custom LinkingTool that lets the user determine the route of a new Link by clicking.
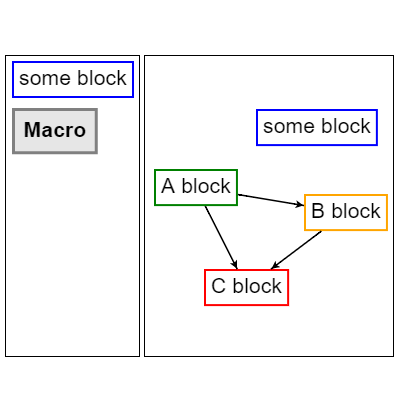
Macros from Palette
Demonstrates an automatic ungrouping of nodes when dropping an element on the diagram.
Magnifier View
An Overview used as a magnifying glass.
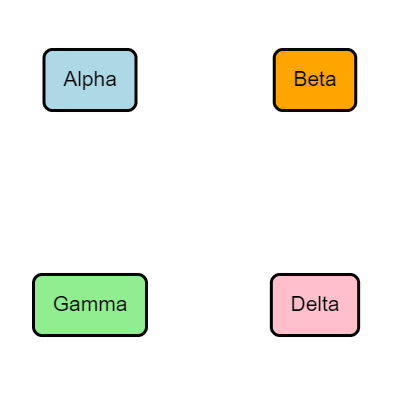
Minimal
Shows default Diagram interactivity and basic data binding. Select, move, copy, delete, undo, redo with keyboard or touch.
Download Image Blob
Minimal, showing image Blob creation with Diagram.makeImageData, and download.
Download SVG
Minimal, showing SVG creation with Diagram.makeSvg, and download.
Minimal Vue.js Sample
Minimal, using Vue.js.
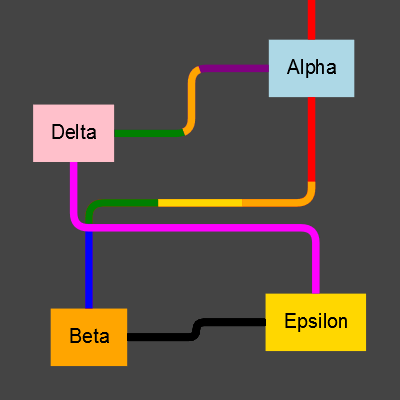
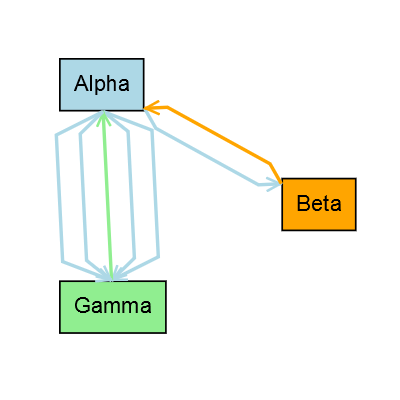
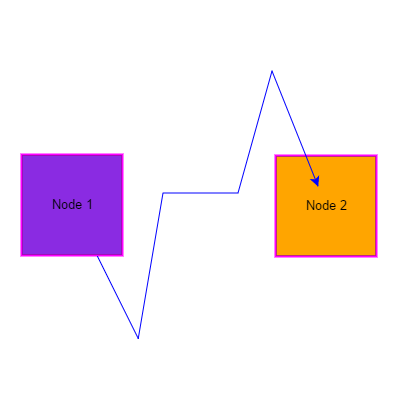
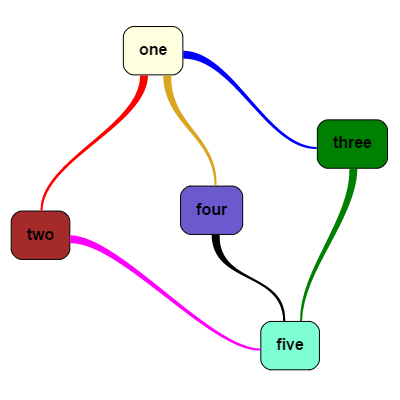
Multi-color Link Paths
Demonstrates a custom Link that can be stroked with multiple consecutive colors.
Multiple Arrowheads Along Link Path
A custom orthogonal Link that draws arrowheads at the end of each segment.
Double Circle
Multiple circles using repeated CircularLayouts.
Org Chart with Assistants on the Side
Shows an org chart with assistant nodes at the side, above regular child nodes.
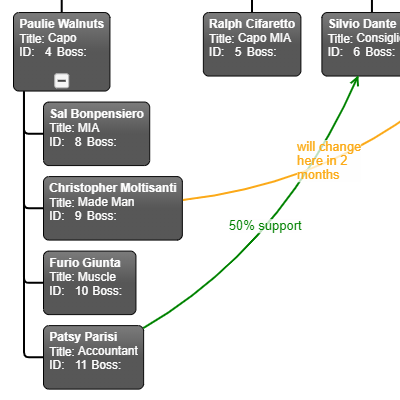
Org Chart With Extra Relationships
Shows an org chart with extra links and expand/collapse functionality.
Packed Hierarchy of Groups
A customized PackedLayout that arranges nested circular groups.
Packed Layout Demo
A custom Layout that positions nodes in a packed area.
Page Flow Diagram Editor
A diagram representation of webpage flow.
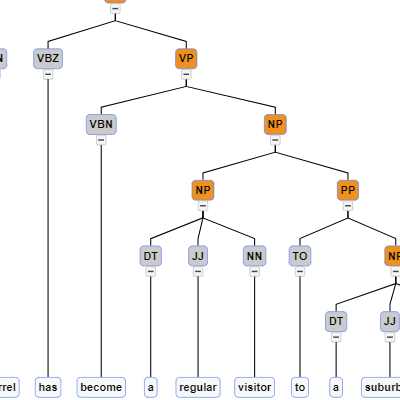
Parse Tree
A Parse tree representing the syntactic structure of a sentence. The leaf nodes are shown in a horizontal line.
PDF generation
Generating a PDF file holding all of the pages of a Diagram's rendering.
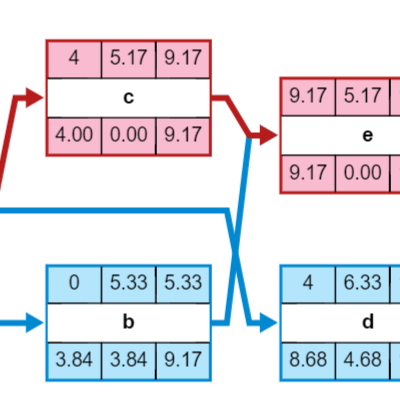
PERT Chart with Legend
A simple PERT chart, showcasing GoJS table panels and RowColumnDefinition properties.
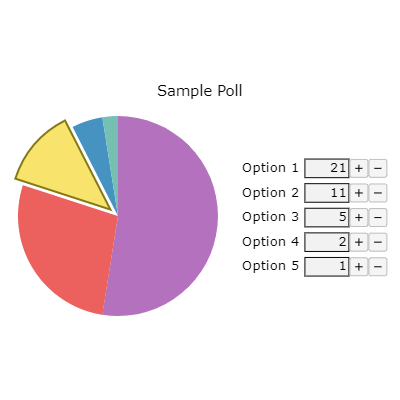
Dynamic Pie Chart
Dynamic pie chart with selectable slices that can change size.
Pie Charts
Simple pie charts within nodes.
Pipe Tree
A tree layout with rectangular nodes at alternating angles and no links.
Planogram
Drag-and-drop items from the Palette onto racks in the Diagram.
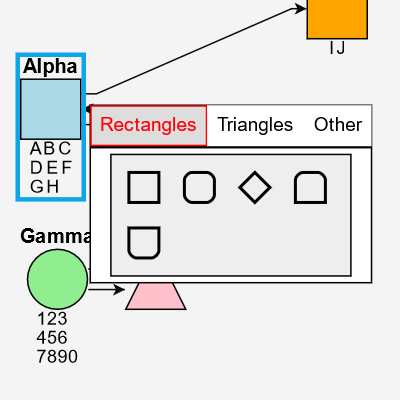
Navigation
Displays relationships between different parts of a diagram.
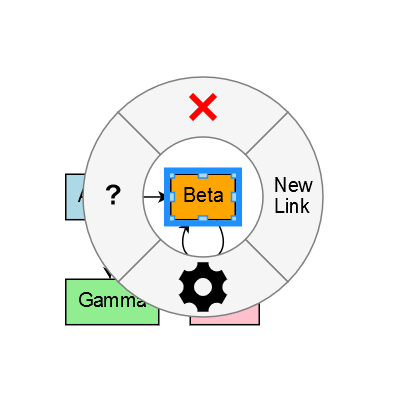
Radial Adornment
An adornment showing buttons in a circle on one selected node.
Realtime Selection
A custom Tool that lets a user drag and create a box to select nodes and links.
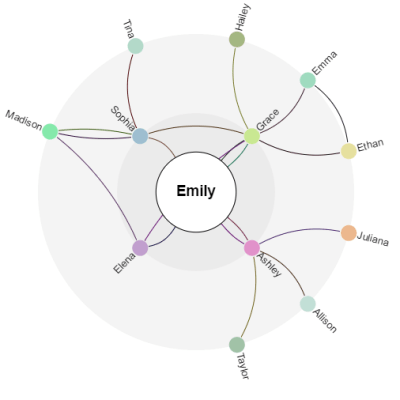
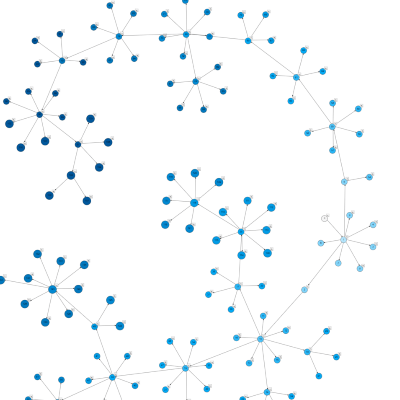
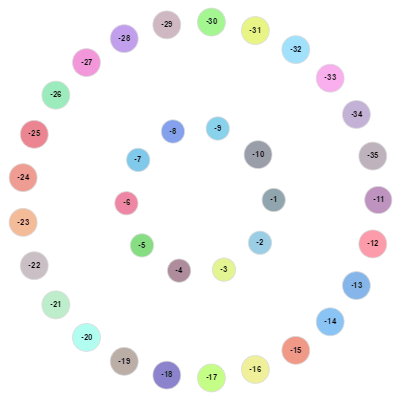
Radial Layout
Arrange people in circles around a central person, in layers according to distance from the central person.
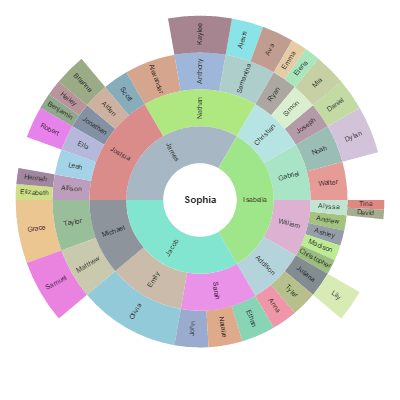
Radial Partition
Arrange people in rings around a central person, in layers according to distance from the central person.
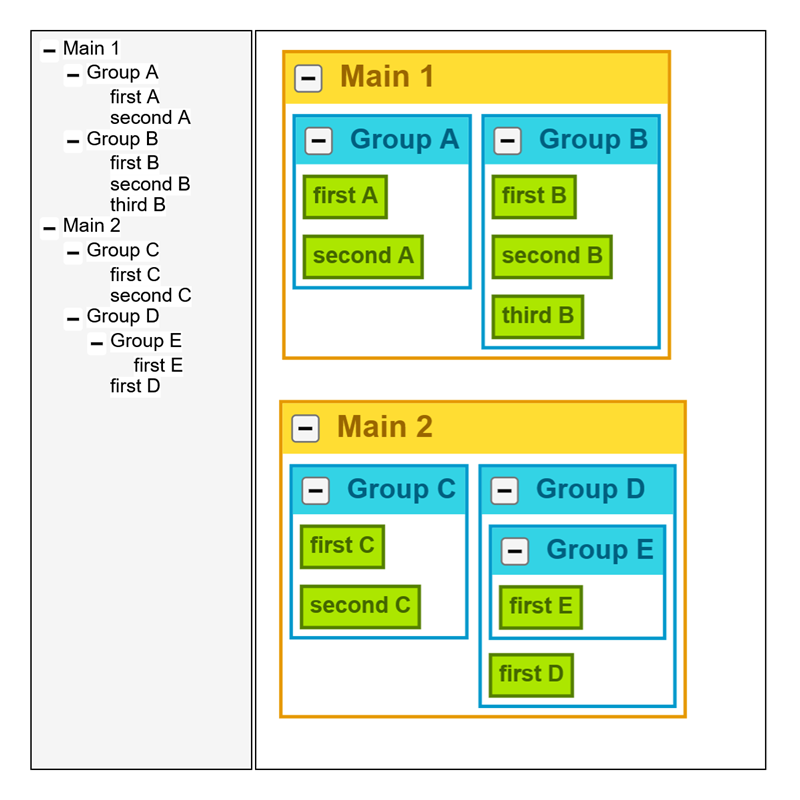
Regrouping Editor and Simultaneous Tree View
Regrouping with tree view of grouping hierarchy.
Rendering SVG to Data URL with Inline Images
In makeSvg, replace image sources with Base64
Rescaling by Dragging Handle
A custom Tool that lets a user change the scale of an object.
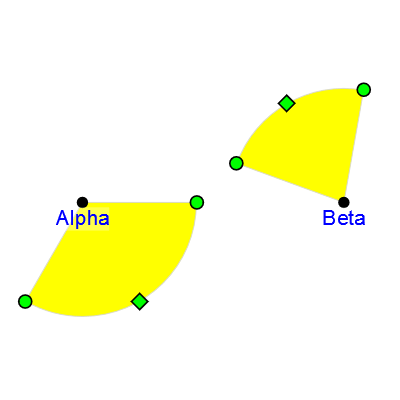
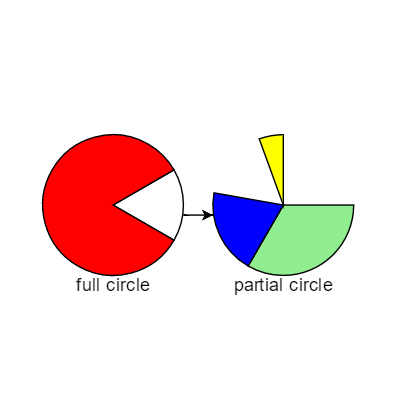
Reshaping and Rotating Sectors of Circles
A custom Tool that supports interactive reshaping of pie-shaped sectors of circles.
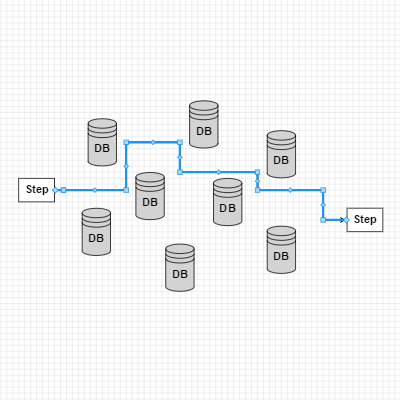
Reshaping Links Snaps to Grid
A custom Tool that allows reshaping links with grid snapping.
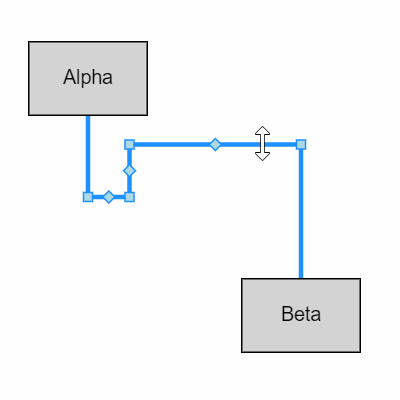
Orthogonal Link Reshaping
A custom Tool that lets the user reshape orthogonal links by dragging entire segments.
Resizing Multiple
A custom ResizingTool that lets the user resize many selected objects at once.
Resizing of Overview Box
A custom Tool which allows the user to resize the overview box.
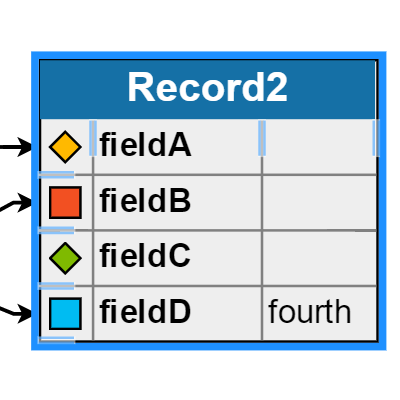
Table Row and Column Resizing
Two custom Tools that let the user resize the width of columns or the height of rows in a Table Panel of a Node.
Resizing via Pinch Zooming
Demonstrates customization of pinch-zooming to scale a node.
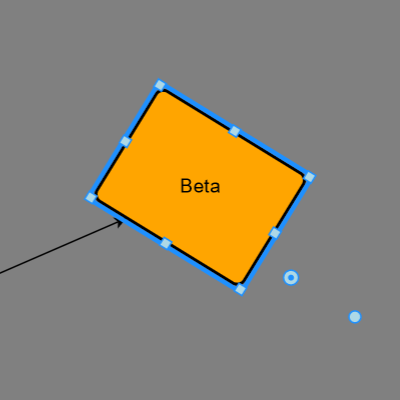
Rotate Multiple
A custom RotatingTool that lets the user rotate many selected objects at once.
Rotating Node about Movable Rotation Spot
A custom RotatingTool that lets the user shift the rotation point.
Link Label Router
A demonstration of the LinkLabelRouter extension based on the Dynamic Ports sample. Move Nodes or create new links to demonstrate that link labels will automatically move to a nearby location to avoid overlapping.
Local Files
Demonstrates saving and loading model files on the local machine
Scrolling Table Panels with ScrollBars
Demonstrates a custom Table Panel with a scrollbar implemented in GoJS, including two AutoRepeatButtons.
Selectable Fields in Record Nodes
Records with fields that the user can select.
Selectable, Deletable Ports in Nodes
A Node with ports that can be selected and deleted.
Adornment Buttons
Selected nodes show a row of buttons that execute commands or start tools.
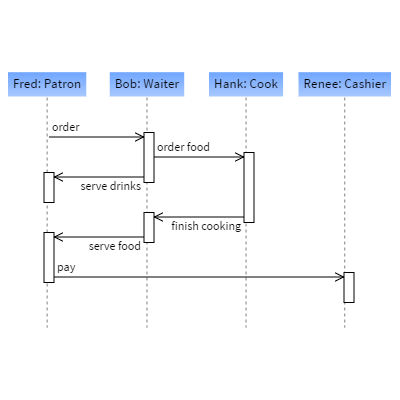
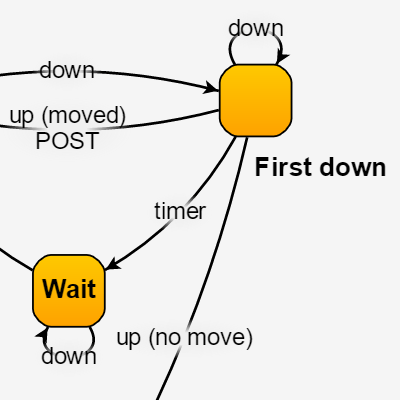
Sequence Diagram
A sequence diagram illustrates how different processes interact with one-another and in what order.
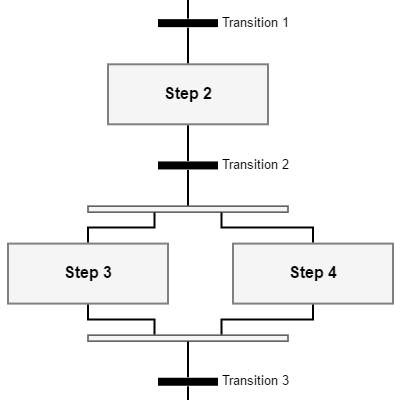
Sequential Function Chart
A sequence diagram that shows different node templates, LayeredDigraphLayout and in-place text editing.
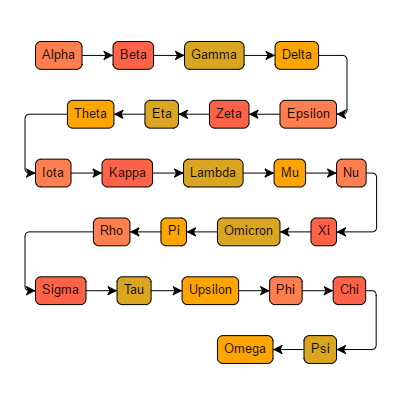
Serpentine Layout
A custom Layout that positions a chain of nodes in rows of alternating direction.
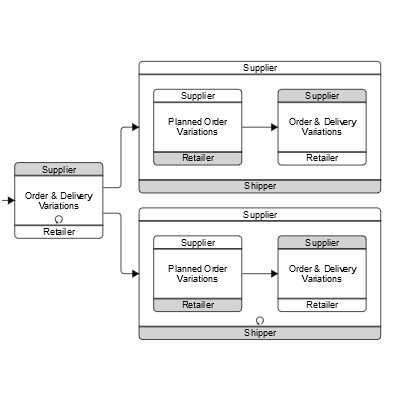
Shared States not using Groups
As an alternative to using Groups, this manages Nodes that simultaneously belong to multiple containers.
Shifting Link Connections
A custom Tool that adds handles on Links to allow the user to shift the end point of the Link along the sides of the port without disconnecting it.
Shifting Ports in Nodes
A custom Tool that lets the user drag a port in a Spot Panel of a Node.
Shop Floor Monitor
Shows the continuously updating state of a number of stations on an imaginary shop floor.
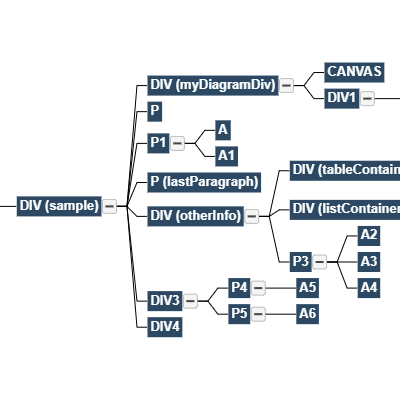
DOM Tree
Shows the DOM of this page displayed as a tree. Selection highlights the DOM element in the page.
Simulating Input using Robot
Demonstrates use of the Robot class to simulate mouse events.
Single Page Diagram Editor with Legend
Show a diagram on a sheet of paper, limiting dragging and resizing to stay within the page minus margins.
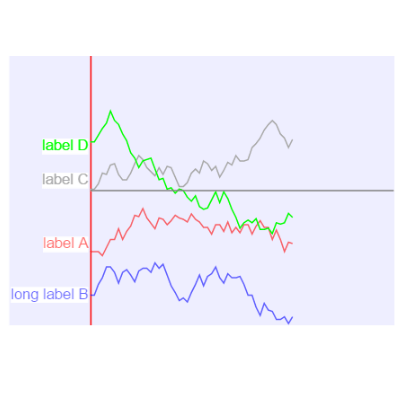
Sparkline Charts in Nodes
Simple sparkline charts within nodes.
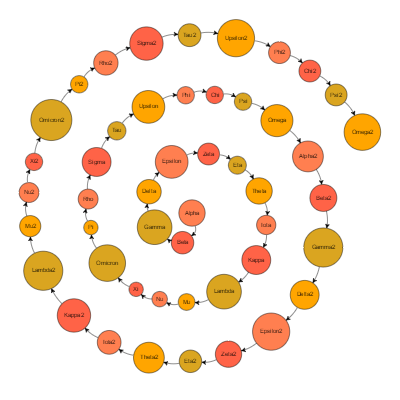
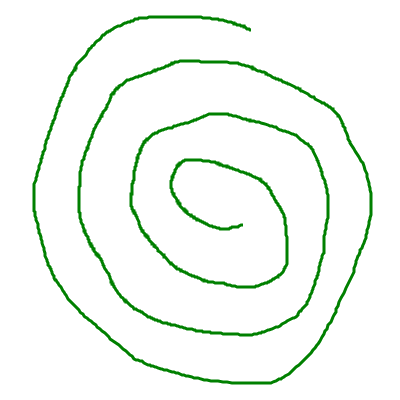
Spiral Layout of Node Chains
A custom Layout that positions a chain of nodes in a spiral.
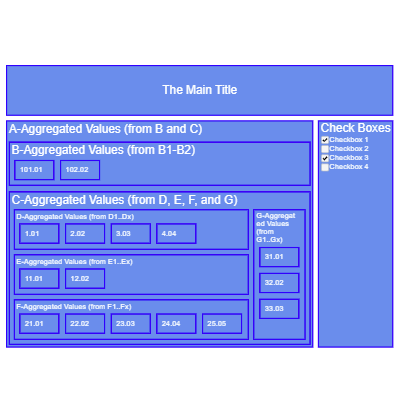
Spreadsheet-like Nested Table Panels
An example of nested Table Panels forming a spreadsheet-like grid.
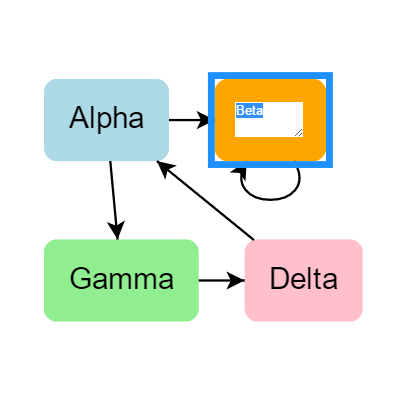
Standard HTMLInfo Text Editor
Demonstrates using an HTMLInfo that acts as a re-implementation of the default text editor.
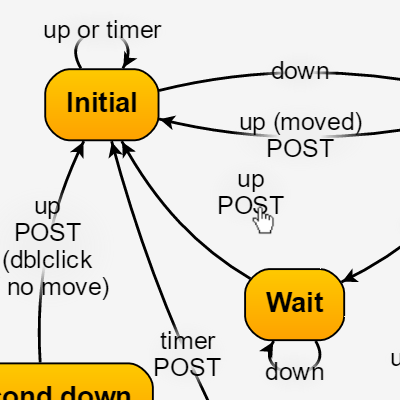
State Chart Editor Saving Incremental JSON
State Chart using incremental JSON.
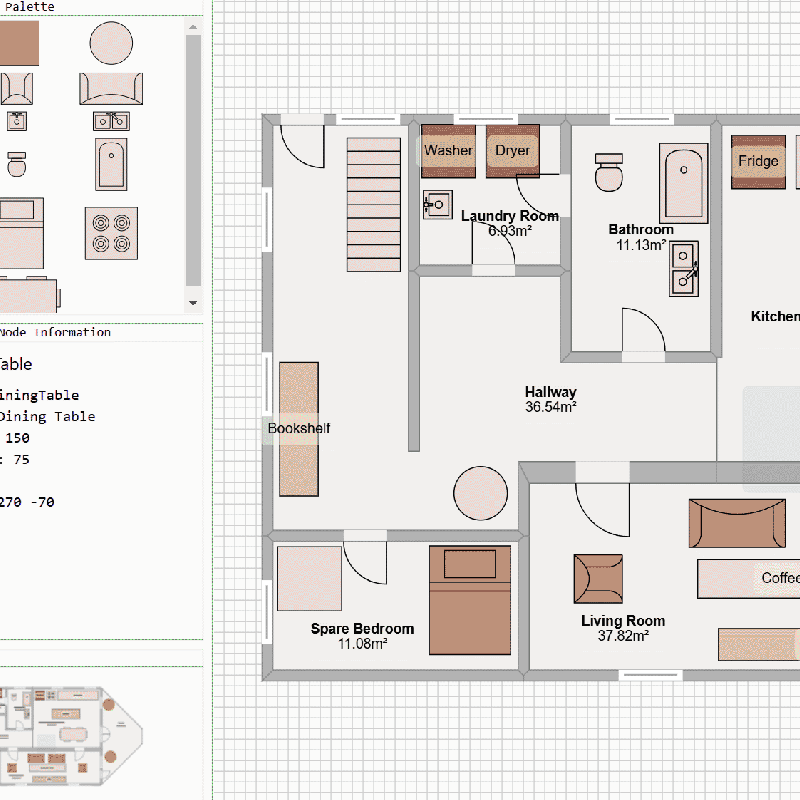
Svelte Floorplanner
A floor planner demo app built with GoJS and Svelte
Swim Lane Layout Keeps Nodes in their Lanes
A custom Layout that puts nodes into swimlanes with dependencies that cross lanes.
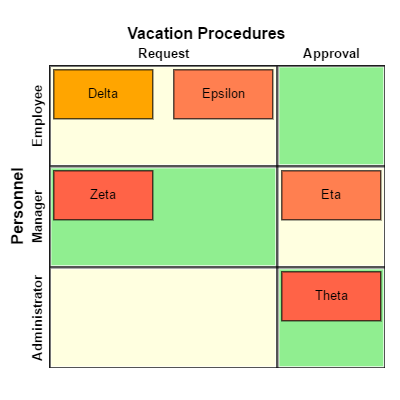
Table Layout of Nodes in Rows and Columns
A custom Layout that arranges Nodes just as a Table Panel arranges GraphObjects.
Tapered Links
Demonstrates a custom Geometry for Link paths.
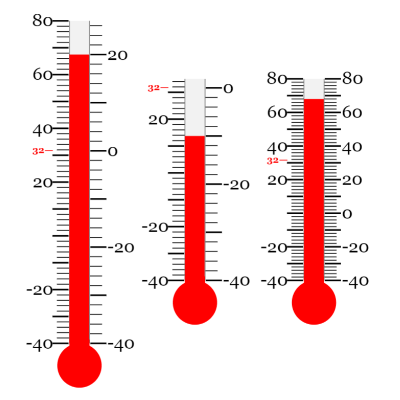
Thermometer Nodes using Graduated Panels
Graduated thermometer scales using Graduated Panel.

SVG Tiger using Shapes
Shows a tiger rendered in SVG without using a Picture
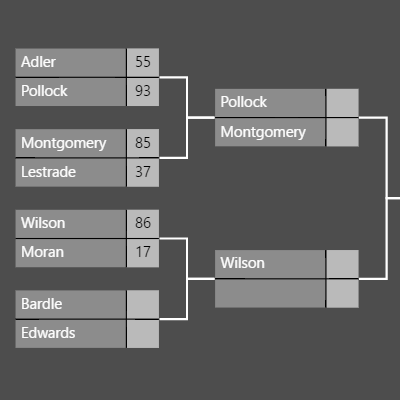
Tournament Bracket
Tournament bracket with dynamic advancement as scores are entered.
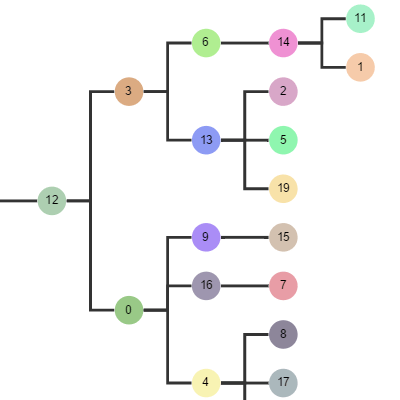
Tree Layout Demo
Shows TreeLayout and options. Positions nodes of a tree-structured graph in layers (rows or columns).
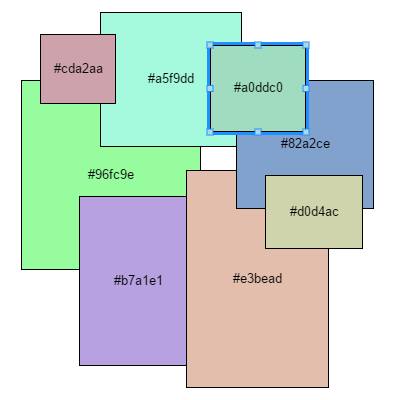
Tree Map of Nested Groups
A custom Layout that renders nested Groups into the viewport with each Node having an area proportional to its declared 'size'.
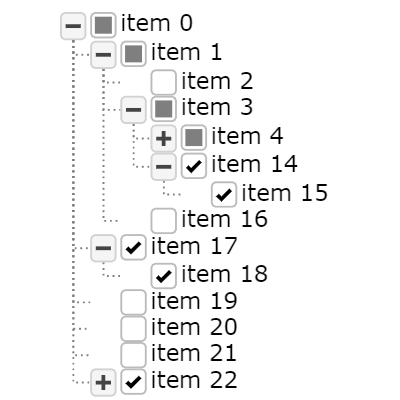
Tri-state CheckBox Tree
Demonstrates a traditional 'Tree View' in a GoJS diagram, where each item has a checkbox with three states.
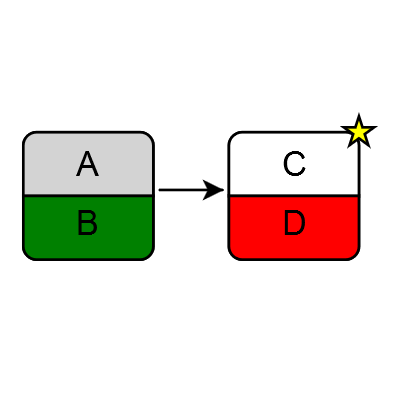
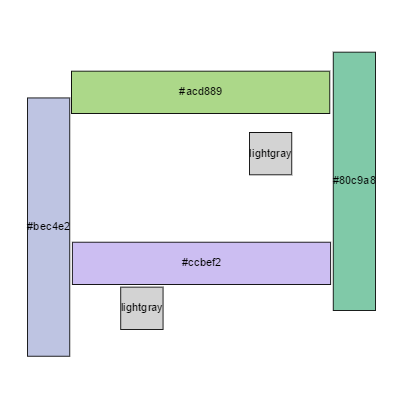
Two Rounded Halves
Nodes consisting of two Panels, using a RoundedTopRectangle and a RoundedBottomRectangle figure.
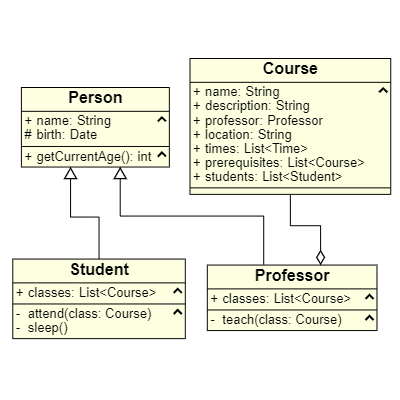
UML Class Diagram Editor
A UML Class diagram shows software classes and their properties and methods, and the relationships between them.
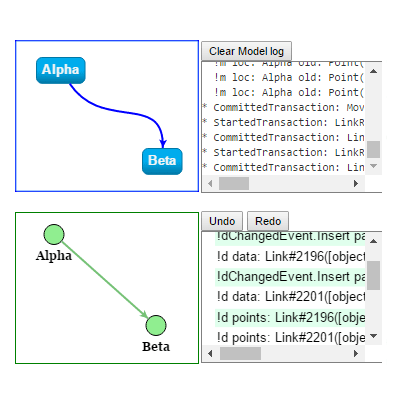
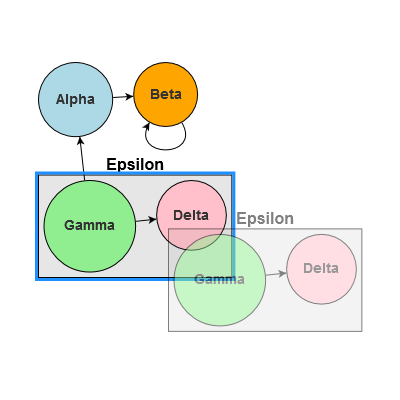
Update Demo
Showcases two Diagrams observing the same Model. Modifying positions in one Diagram will modify them in the model, updating the other Diagram as well.
Various Gestures Demo
Shows different options for ToolManager's gestureBehavior.
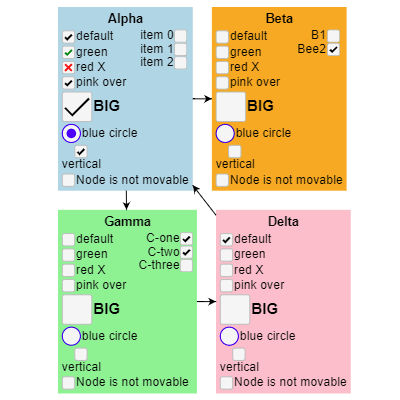
CheckBox Styles
Demonstrates simple uses of CheckBoxButtons.
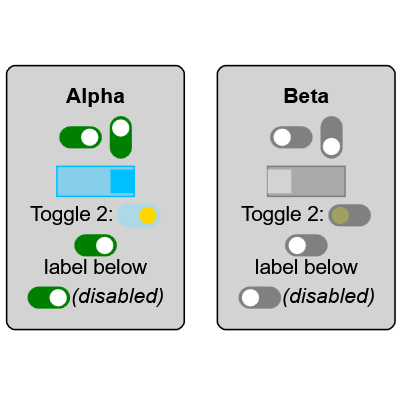
Toggle Styles
Demonstrates simple uses of ToggleSwitches.
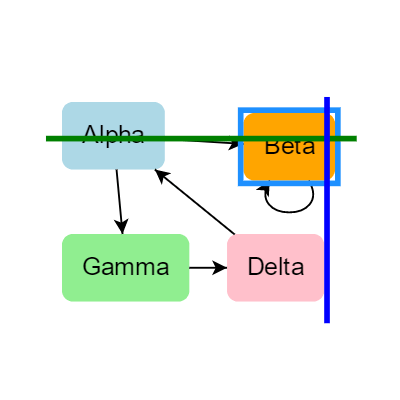
Visual Relationships
Shows how you can create custom renderings for Links by repeatedly drawing GraphObjects along the route.
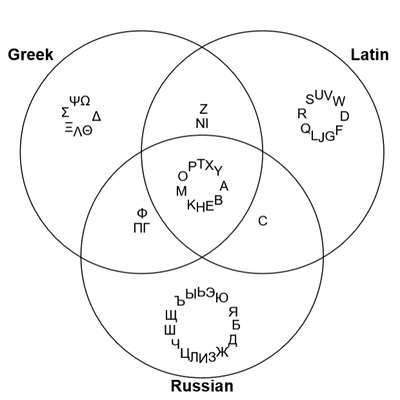
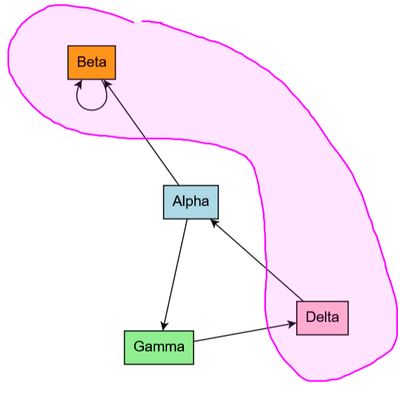
Venn Diagram
Venn Diagram of Common Glyphs in Greek, Latin, and Russian
Data Flow Diagram (Vertical)
Same as Data Flow, but vertically oriented, and with slightly different styling.
Swim Lanes (Vertical)
Demonstrates collapsible, resizable, re-orderable swimlanes, a kind of process-flow diagram, with custom dragging rules that disallow nodes from leaving their lane.
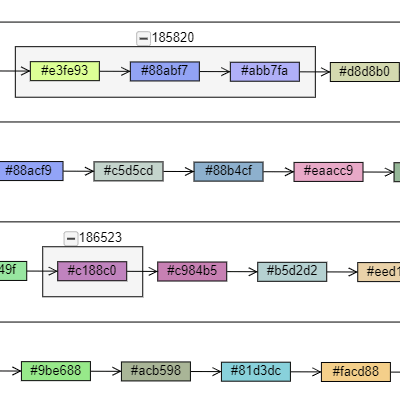
Virtualized Diagram no Layout
Virtualized no Layout, an example of virtualization where the model holds 123,456 node data yet the diagram only creates a few nodes at a time.
Virtualized Diagram with Force Directed Layout
Shows a virtualized ForceDirectedLayout with GraphLinksModel.
Virtualized Diagram with Packed Layout
A virtualized version of PackedLayout that positions nodes in a packed area.
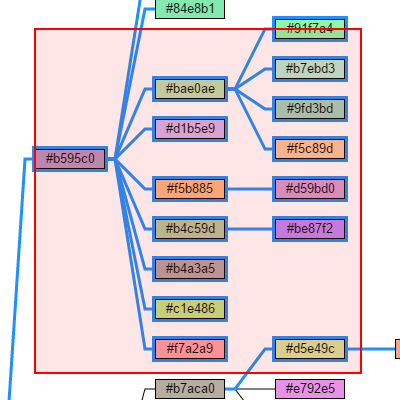
Virtualized Tree
An example of virtualization where the model holds 123,456 node data yet the diagram only creates a few nodes at a time.
Virtualized Tree with TreeLayout
Shows a virtualized TreeLayout with TreeModel.
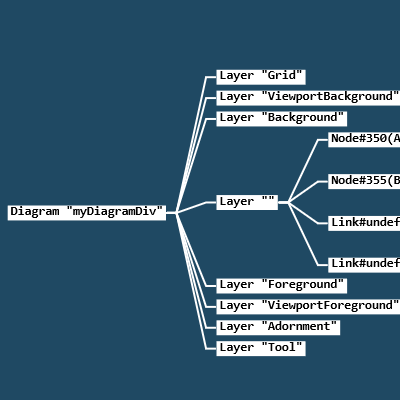
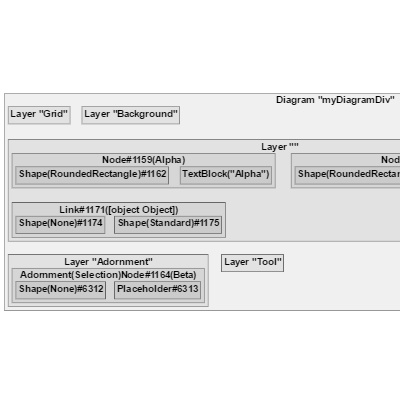
Visual Tree of another Diagram
This sample shows the actual visual tree of a running Diagram, using a second Diagram.
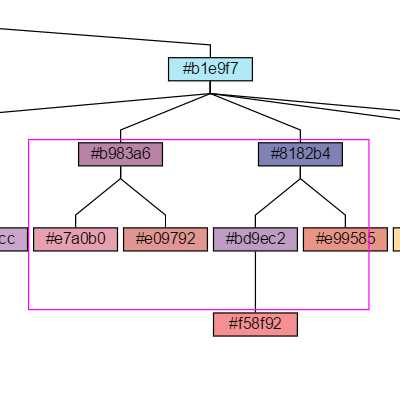
Visual Tree using Groups
This shows the same visual tree using nested Groups instead of nodes and links.
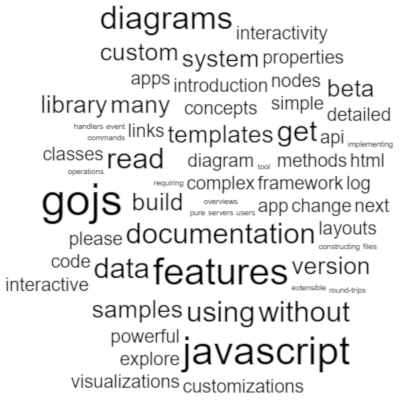
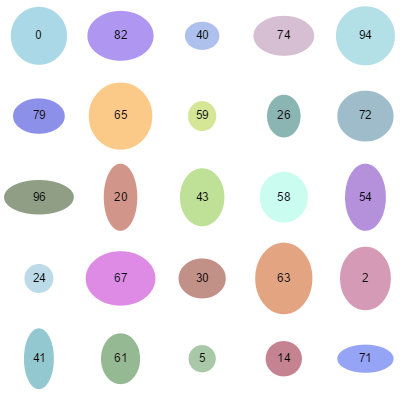
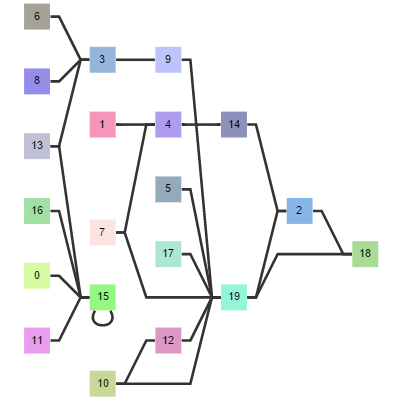
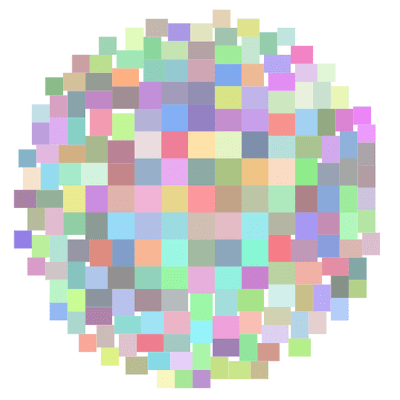
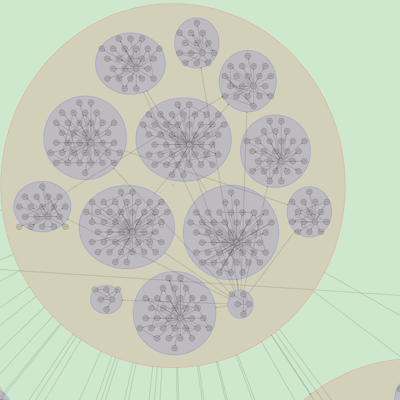
Word Cloud using PackedLayout
A word cloud visualization using the PackedLayout extension.
Spacing Zoom
When zooming, change the spacing of the Nodes, not the Diagram.scale.
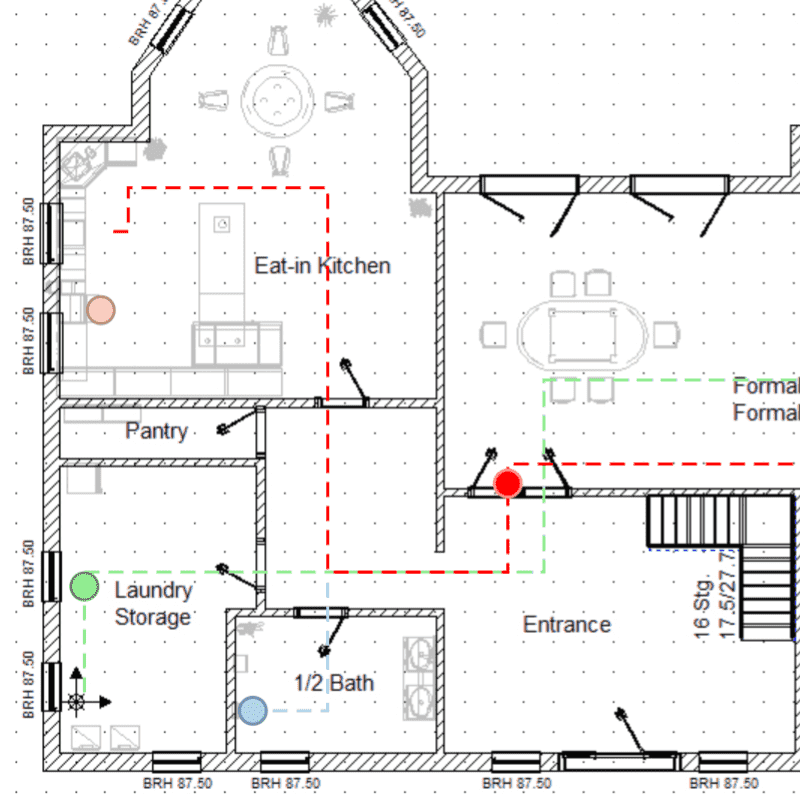
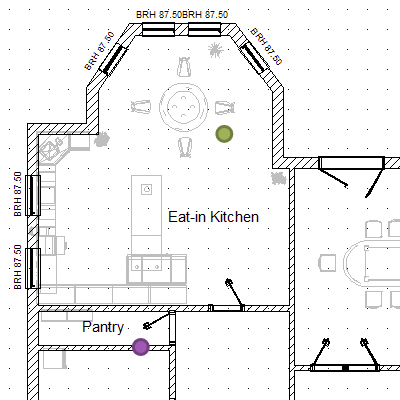
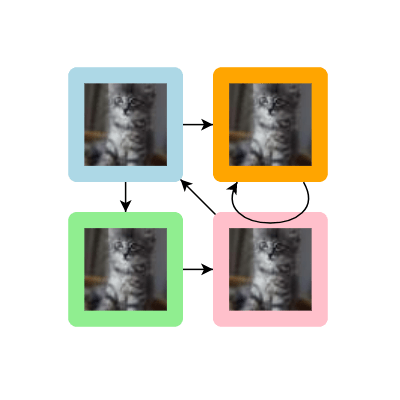
Monitor with Background
A monitoring diagram where the nodes (kittens) move on a background image (a house plan), with tooltips describing kittens.
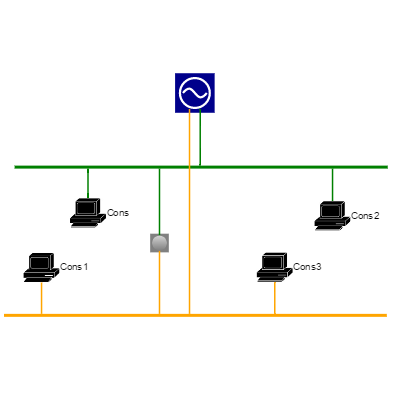
Network Editor with Bars
Shows a network configurator with a Palette and Overview.